The official version of this document can be found via the PDF button.
The below content has been automatically generated from the original PDF and some formatting may have been lost, therefore it should not be relied upon to extract citations or propose amendments.
4.2 Outfall Water Monitoring by Environmental Protection
Executive Summary
- Drainage outfalls along Jersey's coast are routinely monitored, with an emphasis being placed on monitoring during heavy rainfall events to quantify changes in bacteriological loading.
- Environmental Protection have undertaken drainage surveys in conjunction with Transport and Technical Services to try and identify sources of high bacteriological loading.
- Where possible, Environmental Protection have conducted additional sampling of outfalls in response to concerns made by the shellfish farmers during heavy rainfall events.
- Despite the above work, no significant sources of sewage pollution have been identified.
- Overview of outfall monitoring
The Centre for Research into Environment and Health monitored several outfalls around the Island between May and August 1993.
Between 1994 and 1997, Environmental Protection monitored several outfalls along the south-east coast of Jersey. This monitoring programme was established following concerns about shellfish results.
Routine water samples were collected from 23 outfalls around the Island during the period June 2003 to December 2006 to assess the quality of outfall water entering the sea. The main drivers for carrying out this monitoring was to assess ongoing Island outfall water quality and to investigate a bathing water "guide" compliance failure in the St Brelade's Bay that bathing season.
In 2008, outfalls were monitored along the south-east coast after increased levels of Escherichia coli (E.coli) were detected in shellfish flesh.
Since January 2009, up to 15 outfalls have been monitored every other month. This programme selected outfalls that discharge into bathing waters that had failed the bathing water "guide standard" during 2008 as well as several outfalls that discharge into Grouville Bay (which is the location of the oyster beds).
Appendix 1 includes a list of outfall monitoring periods.
During 2009, occasional samples were also collected from the outfalls between Le Hurel and Seymour slip, Le Bourg west, Pontac slip, Greve d'Azette, Weighbridge and First Tower.
It is anticipated that the current outfalls will continue to be monitored every other month for the foreseeable future to establish baseline conditions. Additional outfalls may be included in the future should they become necessary.
- Legislation
Article 7 of The Water Pollution (Jersey) Law 2000 sets out the requirement to monitor controlled waters.
- Stakeholders
Internal stakeholders include The Environment Division, Transport and Technical Services, and Health Protection.
External stakeholders include shellfish farmers, surfers, divers and the general public.
- Potential pollution sources and pathways
Potential pollution sources include: Discharges from the sewerage network, industry and agriculture following prolonged rainfall events, diffuse pollution, contaminated groundwater, leaking/ineffective septic tanks, soakaways and tight tanks, slurry application to land and livestock faeces from animals grazing in fields.
Pollution pathways include: run-off from land entering surface water streams and point source discharges.
- Monitoring undertaken by Environmental Protection
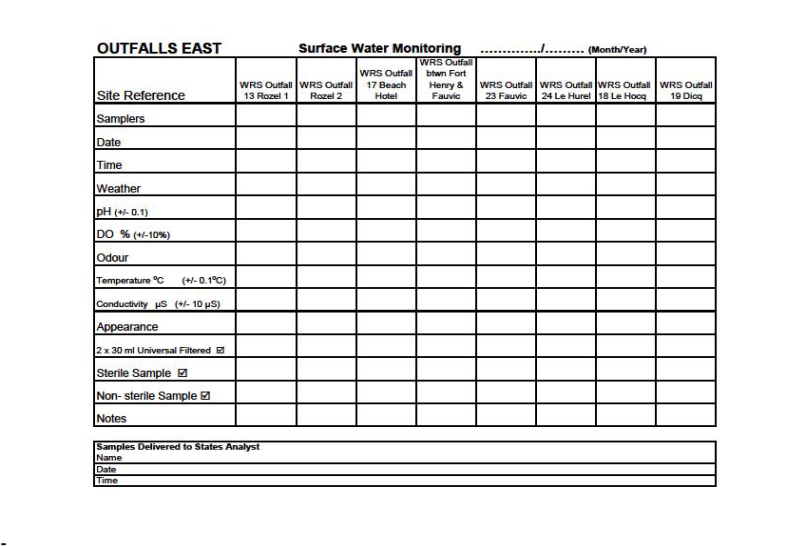
Monitoring of outfalls is undertaken by the Environmental Protection Technician. Samples are collected for field measurements, such as, temperature, pH, conductivity and dissolved oxygen, (see appendix 3 for the outfall field sheet). The field kit used to measure pH and conductivity requires calibrating in the field, see appendix 5 for calibration methodology.
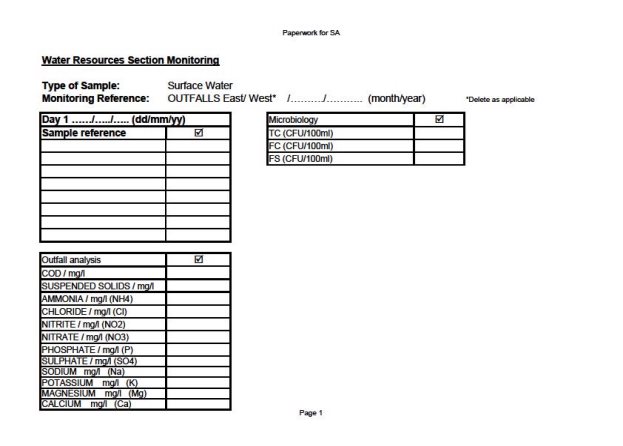
Water samples are collected following a sampling protocol to ensure that sampling is undertaken in a recognised and consistent manner, see appendix 5. A record sheet is completed for the samples submitted to the analyst, see appendix 4.
The States of Jersey Official Analyst Laboratory carries out the analysis of the water samples for concentrations of: Chemical Oxygen Demand (COD), suspended solids, ammonia, chloride, nitrite, nitrate, phosphate, sulphate, sodium, potassium, magnesium, calcium, presumptive total coliforms, presumptive faecal coliforms and presumptive faecal streptococci.
- Analysis and reporting of data
The data collected by the Centre for Research into Environment and Health in 1993 is included in a report titled Assessment of the bacteriological quality of bathing waters and land drainage to the Jersey coastal zone during the 1993 bathing season'.
The data collected between June 2003 and December 2006 was analysed by Dr T A du Feu and an internal report prepared called The abundance of faecal indicator organisms in Jersey outfall waters and the compliance with the Bathing Water Quality Directive 76/160/EEC'.
The current data is checked each month by Environmental Protection and abnormal results are investigated. For example, high bacteria levels were detected at the Wayside outfall during August 2009. This was investigated, monitored and further follow up samples were collected. The pollution incident report is included in appendix 2.
Additional monitoring was carried out during 2008 following higher levels of E.coli being detected in the shellfish. Environmental Protection carried out an investigation of outfalls and traced water pathways from certain outfalls inland. The pollution incident report is included in appendix 2.
- Budget, manpower and resources considerations
The analysis costs are covered in the Service Level Agreement.
Staff time for carrying out the monitoring is six days per year with a further three days spent inputting and checking data, and preparing and cleaning equipment.
- Constraints
Outfall monitoring is tide dependent and is one of the first types of monitoring to be scheduled into the annual timetable. Some outfalls can only be safely accessed around the time of the lowest spring tides such as the Weighbridge outfall and First Tower outfall.
The timing of the sampling is restricted to Monday, Tuesday and Wednesday, as the microbiological analysis takes three days to complete. Samples must also be received by the States of Jersey Official Analyst Laboratory by 14:00 to ensure the analysis is completed within the required time period.
The maximum number of samples that the Analyst can accept on an outfall run is six during the bathing water season due to the additional dilutions required for microbial analysis of outfall waters.
- Addressing of constraints by Environmental Protection
Outfalls were not monitored during 2007 and 2008 due to a reallocation of those sampling resources to a surface water project in the Trinity Catchment. Once two years of baseline data had been collected resources were available to monitor some outfalls again. All routine monitoring is timetabled by October each year and forwarded to the States of Jersey Official Analyst prior to the end of the calendar year.
Samples could be collected on Thursdays and Fridays but this would mean that The States of Jersey Official Analyst Laboratory staff would be required to work during the weekend to complete the microbiological analysis.
Collecting samples in the afternoon would mean that The States of Jersey Official Analyst Laboratory staff would be required to work late on these days as sample analysis must commence within six hours of collection.
The collection of samples during heavy rainfall events would give Environmental Protection additional data for the bacterial loading from each outfall in these conditions. This would be limited by the States of Jersey Official Analyst Laboratory ability to fit the additional sampling work into their schedule.
Appendix 1: Data Series
May to August 1993
Long Gunsite outfall
Short Gunsite outfall
The Dicq outfall
Greve D'Azette
Le Hocq (slip)
Pontac slip
Pontac (not adjacent to slip),
Le Bourg (west)
Le Bourg (closest to slip)
Outfall between Seymour slip and Le Hurel
Le Hurel
Fauvic
Outfall between Fauvic and Fort Henry
Fort Henry
Beach Hotel
Greve de Lecq
June 2003 to December 2006 (east run first month and west run second month) Bouley Bay
Rozel (closest to La Brecque du Nord)
St Catherine
Beach Hotel
Long Beach
Fort Henry
Fauvic
Le Hurel
Le Bourg (closest to slip)
Pontac (not adjacent to slip),
Le Hocq (slip)
Greve d'Azette
The Dicq
Greve de Lecq
La Saline
St Ouen's Pond
Petit Port
St Brelade Church
L'Horizon
Ouaisne
St Aubin's Harbour
Gunsite (long outfall)
Millbrook
First Tower
2008
Long Beach Fort Henry Fauvic
January 2009 to date (east run first month and west run second month) Rozel (both outfalls)
Beach Hotel
Outfall between Fort Henry and Fauvic
Fauvic
Le Hurel
Le Hocq
The Dicq
Greve de Lecq
St Brelade Church
Wayside Slip
St Aubin's Harbour
La Haule
Bistro Soleil outfall
Gunsite (short outfall).
During 2009 occasional samples were collected from: Outfall between Le Hurel and Seymour slip,
Le Bourg (closest to slip)
Le Bourg (west)
Pontac slip
Greve d'Azette
Weighbridge
First Tower.
Appendix 2: Pollution Incident Reports
2009127 The Wayside Outfall 2008065 Grouville foreshore
Please see appendices folder for incident reports
Appendix 3: Outfall Field Sheet (example)
Submission made by Environmental Protection to the Environment Scrutiny Panel's review on 8 Protecting Our Marine Environment - Monitoring and Regulation of Coastal Waters'
Appendix 4: Outfall Analyst Sheet
Appendix 5: Sampling protocols and instructions for calibrating
instruments for outfall monitoring
SOP 29 - Sampling of surface waters for all major cations and anions, total ammonia, suspended solids and chemical oxygen demand
- Ensure the sampler is wearing the appropriate protective clothing.
- Select polyethylene or polypropylene bottle/container of an appropriate volume (minimum 250ml).
- Label the bottle/container and lid with permanent marker
- Select a representative sampling position – taking into account access, flow, and depth.
- Stagnant areas, banks, and pools should be avoided and particular care is needed not to disturb the bottom sediments.
- Fill the bottle directly from the stream ensuring the opening is facing upstream. The sample bottle/container should be rinsed out with the stream water twice. Fill the bottle completely leaving no air gap. If the flow in the stream is low and has meant that an insufficient sample volume has been collected use another clean, rinsed container to sub-sample.
- Replace the cap immediately.
- Secure the cap and immediately place the bottle upright in the cool box. This should ensure that the sample is kept cool (2-10oC) and away from UV light.
- If accidental contamination is suspected, the sample must be discarded and a fresh bottle used to take a further sample.
- Fill in a Chain of Custody form for the States Analyst
- Samples must be delivered to the States Analyst and analysed as soon as possible after collection.
- If analysis for parameters other than those listed above is required, contact the States Analyst in advance to ask if particular containers or volumes are needed.
SOP 34 - Microbiological sampling of surface waters
- Ensure the sampler is wearing the appropriate protective clothing.
- Select a sterile single-use pre-sterilised disposable plastic containers
- Label the bottle/container with permanent marker, noting the site number.
- Select a representative sampling position – taking into account access, flow, and depth.
- Stagnant areas, banks, and pools should be avoided and particular care is needed not to disturb the bottom sediments.
- Hold the sample bottle with one hand and remove the cap with the other. Care must be taken not to contaminate the inside of the lid or bottle with the hands etc. The cap should not be put face down on any surface.
- The sample bottle/container should never be rinsed out. Fill the bottle directly from the stream ensuring the opening is facing upstream. Leaving a small air gap to allow shaking/mixing during analysis. If the flow in the stream is low and has meant that an insufficient sample volume has been collected use another sterile container to sub-sample.
- Replace the cap immediately.
- Secure the cap and shake the sample before immediately placing it upright in the cool box. This should ensure that the sample is kept cool (2-10oC) and
away from UV light.
- If accidental contamination is suspected, the sample must be discarded and a fresh, sterile bottle used to take a further sample.
- Samples must be delivered to the laboratory and analysed as soon as possible after collection as incubation should begin within 6 hours.
SOP 35 - Dissolved oxygen measurement
- Connect the dissolved oxygen probe meter.
- Turn on the instrument.
- Rinse the probe to waste with distilled water, and shake off the excess water.
- To measure the dissolved oxygen concentration of a solution, immerse the probe in the solution.
- To ensure accuracy of measurements they are performed in duplicate. The readings are acceptable if they are within 5 digits of each other. The mean value of the 2 compatible readings is then calculated.
- Record the displayed value in the appropriate record sheet.
Calibration of WTW universal pocket meter Multiline P4 and pH measurement
Calibration
- Half fill the large plastic container with water at the site in order to calibrate the pH meter.
- Place all three buffer solutions into the water and leave for 10 minutes to allow the buffers to adjust to the temperature of the water to be tested.
- Connect the pH probe and temperature probe to the meter.
- Press "on/off" button to switch meter on.
- Check that the probe symbol in the top right hand corner of the display contains the full three bars for best results.
- Press the "pH/mV/ O2 x" button until the pH symbol appears in top left hand corner of the display.
- Rinse the pH probe thoroughly with distilled water.
- Press the "CAL" button.
- Immerse probe into the first buffer solution (pH 4.01).
- Press the "RUN/ENTER" button. In the bottom right hand corner of the display window "AR" will flash. After a period of one to two minutes the display will change to "CE2".
- Rinse the pH probe thoroughly with distilled water.
- Immerse probe into the second buffer solution (pH 10.00).
- Press the "RUN/ENTER" button so that "AR" flashes in the display window. After a period of one to two minutes the display will change to measure the slope of the electrode, for example "-59.6". The admissible range is - 50.0mV/pH to -62.0mV/pH.
- Rinse the pH probe thoroughly with distilled water.
- Immerse probe into the third buffer solution (pH 7.00).
- Press the "AR" button to switch on drift control to produce a stable measuring result.
- Press the "RUN/ENTER" button so that "AR" flashes in the display window.
- The pH reading will decrease towards neutral. Ideally the pH should read 7.0, but if this is slightly out, say, 7.01 or 7.02 then a note should be made and readings adjusted. If the pH reading is greater than 7.02 or less than 6.98 (buffer 10.00 calibrated before buffer 4.01) the probe should be re-calibrated.
Measurement
- Rinse out a metal container with water at the site to be tested, and half fill the container with water.
- Rinse the pH probe thoroughly with distilled water.
- Immerse the probe into the water sample.
- Press the "AR" button to switch on drift control to produce a stable measuring result.
- Press the "RUN/ENTER" button so that "AR" flashes in the display window.
- Record pH reading once "AR" stops flashing.
- Take a second sample and repeat the measurement.
- If the two readings vary by less than 0.1 calculate the mean of the two readings. If not a third reading should be taken and the mean of the two closest readings calculated.
Other useful information
Probe Symbols
3 bars excellent quality slope -58.0 to -60.5mV/pH 2 bars good quality slope -57.0 to -58.0mV/pH 1 bar sufficient quality slope -56.0 to -57.0mV/pH
or -60.5 to -61mV/pH flashing symbol poor quality slope -50.0 to -56.0mV/pH
or -61.0 to -62.0mV/pH
E3 calibration error
The probe symbol also flashes when the calibration interval has expired. The default calibration interval is 7 days.
Calibration of WTW universal pocket meter Multiline P4 and conductivity measurement.
Calibration
- Half fill the large plastic container with water at the site in order to calibrate the conductivity meter.
- Place the calibration and control standard solution into the water and leave for 10 minutes to allow the solution to adjust to the temperature of the water to be tested.
- Connect the conductivity probe to the meter.
- Press "on/off" button to switch meter on.
- Check that the probe symbol in the top right hand corner of the display contains the full three bars for best results.
- Press the "pH/mV/ O2 x" button until the conductivity symbol "x" appears in top left hand corner of the display.
- Rinse the conductivity probe thoroughly with distilled water.
- Press the "CAL" button.
- Immerse probe into calibration and control standard solution 0.01 mol/l KCl.
- Press the "RUN/ENTER" button. In the bottom right hand corner of the display window "AR" will flash. After a period of about 30 seconds the display will change to the cell constant, for example "0.476 1/cm".
Measurement
- Rinse out a metal container with water at the site to be tested, and half fill the container with water.
- Rinse the conductivity probe thoroughly with distilled water.
- Immerse the probe into the water sample.
- Press the "AR" button to switch on drift control to produce a stable measuring result.
- Press the "RUN/ENTER" button so that "AR" flashes in the display window.
- Record conductivity reading once "AR" stops flashing.
- Take a second sample and repeat the measurement.
- If the two readings vary by less than 10 calculate the mean of the two readings. If not a third reading should be taken and the mean of the two closest readings calculated.