The official version of this document can be found via the PDF button.
The below content has been automatically generated from the original PDF and some formatting may have been lost, therefore it should not be relied upon to extract citations or propose amendments.
Deputy L Doublet Scrutiny Office States Greffe Morier House
St Helier
JE1 1DD
12th October 2018
Dear Deputy Doublet ,
Information Requested by Gender Pay Gap Review Panel
As the panel noted, information was provided in April 2018. The data presented at this time was based on actual pay for individuals resulting in a skewed outcome in relation to gender pay gaps due to the influence of part-time workers. The reward and employee relations department will be producing a gender pay gap report relating to States employees that follows the criteria required for public bodies in the UK.
Once completed, this report will be presented to SEB and could be supplied the Gender Pay Gap Review Panel, if you wish, and will provide a useful comparison to peers in the UK. A test of this methodology was undertaken in February of this year, and I have attached the report for your information. The appropriate data point to reflect comparability with the UK is 5th April of each year, and this date will be used going forward.
In the meantime, the data provided in April has been updated with August payroll data, it includes all employees paid by the States of Jersey and has been produced on the basis of full-time equivalent pay to ensure the basis is consistent for all employees. This is much closer to the approach taken to Gender Pay Reporting elsewhere and represents a level playing field in a similar manner. It does, however, result in significant inconsistencies with the data produced in April.
It is clear from the gender comparison of part-time versus full-time workers (part-time defined as less than or equal to 25 hours per week) that this is the principal driver for the differences between the data presented in April to the information shown here from August. As at the August payroll date 27% of female workers are part-time, versus less than 6% of male workers. When based on April actual pay, the data presented a picture showing 88% of workers earning less than £10,000 were female. Updating the information to show full-time equivalent results in no-one included, and a much less worrying breakdown thereafter.
I trust the tables below address the questions raised by the Gender Pay Gap Review Panel, and that the inclusion of the outcomes from the trial Gender Pay Gap (GPG) report provides some additional background information and comfort that, although not required to do so, the States will produce a Gender Pay Gap report each year.
For assistance with advertising the call for evidence within the States of Jersey departments please contact the Head of Internal and Change Communications, would be happy to assist.
If you require anything further our Head of Reward, would be happy to meet with you and please do not hesitate to contact me also for any further information.
Yours sincerely,

Senator Tracey Vallois
Chair – States of Jersey Employment Board
All employees split by pay level in £10,000 increments, as at August 2018
Number of Men and Woman by each Pay Band | ||||||
Pay Band | Male | Female | Total |
| % Male | % Female |
£1 - £10,000 |
|
|
|
|
| |
£10,001 - £20,000 | 12 | 1 | 13 | 92.3% | 7.7% | |
£20,001 - £30,000 | 475 | 925 | 1,400 | 33.9% | 66.1% | |
£30,001 - £40,000 | 477 | 1,122 | 1,599 | 29.8% | 70.2% | |
£40,001 - £50,000 | 516 | 980 | 1,496 | 34.5% | 65.5% | |
£50,001 - £60,000 | 483 | 748 | 1,231 | 39.2% | 60.8% | |
£60,001 - £70,000 | 137 | 215 | 352 | 38.9% | 61.1% | |
£70,001 - £80,000 | 99 | 108 | 207 | 47.8% | 52.2% | |
£80,001 - £90,000 | 121 | 80 | 201 | 60.2% | 39.8% | |
£90,001 - £100,000 | 50 | 26 | 76 | 65.8% | 34.2% | |
£100,001 - £110,000 | 15 | 14 | 29 | 51.7% | 48.3% | |
£110,001 - £120,000 | 13 | 12 | 25 | 52.0% | 48.0% | |
£120,001 - £130,000 | 23 | 11 | 34 | 67.6% | 32.4% | |
£130,001 - £140,000 | 21 | 4 | 25 | 84.0% | 16.0% | |
£140,001 - £150,000 | 6 | 4 | 10 | 60.0% | 40.0% | |
£150,001 - £160,000 | 17 | 3 | 20 | 85.0% | 15.0% | |
£160,001 - £170,000 | 2 |
| 2 | 100.0% |
| |
£170,001 - £180,000 |
| 1 | 1 |
| 100.0% | |
£180,001 - £190,000 |
| 1 | 1 |
| 100.0% | |
£190,001 - £200,000 |
|
|
|
|
| |
£200,001 - £210,000 | 1 |
| 1 | 100.0% |
| |
£210,001 - £220,000 | 2 |
| 2 | 100.0% |
| |
£220,001 - £230,000 | 2 |
| 2 | 100.0% |
| |
£230,001 - £240,000 |
|
|
|
|
| |
£240,001 - £250,000 | 1 |
| 1 | 100.0% |
| |
£250,001 - £260,000 |
|
|
|
|
| |
£260,001 - £270,000 |
|
|
|
|
| |
£270,001 - £280,000 |
|
|
|
|
| |
£280,001 - £290,000 |
|
|
|
|
| |
£300,001 - £310,000 | 1 |
| 1 | 100.0% |
| |
Total | 2,473 | 4,255 | 6,728 | 36.8% | 63.2% | |
|
|
|
|
|
|
|
|
|
|
|
|
|
|
|
|
|
|
|
|
|
|
|
|
|
|
|
|
|
|
|
|
|
|
|
|
|
|
|
|
|
|
|
|
|
|
|
|
|
|
|
|
|
|
|
|
|
|
|
|
|
|
|
|
|
|
|
|
|
|
|
|
|
|
|
|
|
|
|
|
|
|
|
|
|
|
|
|
|
|
|
|
|
|
|
|
|
|
|
|
|
|
|
|
|
|
|
|
|
|
|
|
|
|
|
|
|
|
|
|
|
|
|
|
|
|
|
|
FTE Pay Levels split by Gender and Age Group
Total - Male | |||||||
Pay Band | 16-19 | 20-29 | 30-39 | 40-49 | 50-59 | 60 + | Total |
£1 - £10,000 |
|
|
|
|
|
|
|
£10,001 - £20,000 | 6 | 4 | 1 | 1 |
|
| 12 |
£20,001 - £30,000 | 6 | 65 | 86 | 127 | 154 | 37 | 475 |
£30,001 - £40,000 | 1 | 94 | 99 | 107 | 142 | 34 | 477 |
£40,001 - £50,000 |
| 60 | 168 | 144 | 127 | 17 | 516 |
£50,001 - £60,000 |
| 16 | 114 | 181 | 152 | 20 | 483 |
£60,001 - £70,000 |
| 2 | 36 | 51 | 41 | 7 | 137 |
£70,001 - £80,000 |
| 1 | 19 | 42 | 29 | 8 | 99 |
£80,001 - £90,000 |
| 3 | 21 | 38 | 51 | 8 | 121 |
£90,001 - £100,000 |
| 1 | 11 | 19 | 15 | 4 | 50 |
£100,001 - £110,000 |
|
| 1 | 8 | 6 |
| 15 |
£110,001 - £120,000 |
|
| 2 | 5 | 4 | 2 | 13 |
£120,001 - £130,000 |
|
| 1 | 10 | 9 | 3 | 23 |
£130,001 - £140,000 |
|
|
| 8 | 11 | 2 | 21 |
£140,001 - £150,000 |
|
|
| 3 | 2 | 1 | 6 |
£150,001 - £160,000 |
|
|
|
| 8 | 9 | 17 |
£160,001 - £170,000 |
|
|
| 1 | 1 |
| 2 |
£170,001 - £180,000 |
|
|
|
|
|
|
|
£180,001 - £190,000 |
|
|
|
|
|
|
|
£190,001 - £200,000 |
|
|
|
|
|
|
|
£200,000 + |
|
|
| 1 | 3 | 3 | 7 |
Total | 13 | 246 | 559 | 746 | 755 | 155 | 2,474 |
Total - Female | |||||||
Pay Band | 16-19 | 20-29 | 30-39 | 40-49 | 50-59 | 60 + | Total |
£1 - £10,000 |
|
|
|
|
|
|
|
£10,001 - £20,000 |
|
| 1 |
|
|
| 1 |
£20,001 - £30,000 | 5 | 117 | 188 | 226 | 304 | 85 | 925 |
£30,001 - £40,000 | 3 | 189 | 214 | 308 | 339 | 69 | 1,122 |
£40,001 - £50,000 |
| 164 | 276 | 269 | 233 | 38 | 980 |
£50,001 - £60,000 |
| 26 | 196 | 301 | 199 | 26 | 748 |
£60,001 - £70,000 |
| 4 | 56 | 86 | 64 | 5 | 215 |
£70,001 - £80,000 |
| 7 | 23 | 44 | 28 | 6 | 108 |
£80,001 - £90,000 |
| 3 | 15 | 28 | 28 | 6 | 80 |
£90,001 - £100,000 |
| 1 | 3 | 10 | 11 | 1 | 26 |
£100,001 - £110,000 |
|
| 1 | 7 | 6 |
| 14 |
£110,001 - £120,000 |
|
| 1 | 3 | 8 |
| 12 |
£120,001 - £130,000 |
|
| 2 | 3 | 6 |
| 11 |
£130,001 - £140,000 |
|
| 1 |
| 2 | 1 | 4 |
£140,001 - £150,000 |
|
|
| 1 | 3 |
| 4 |
£150,001 - £160,000 |
|
| 1 |
| 2 |
| 3 |
£160,001 - £170,000 |
|
|
|
|
|
|
|
£170,001 - £180,000 |
|
|
|
| 1 |
| 1 |
£180,001 - £190,000 |
|
|
|
| 1 |
| 1 |
£190,001 - £200,000 |
|
|
|
|
|
|
|
£200,000 + |
|
|
|
|
|
|
|
Total | 8 | 511 | 978 | 1,286 | 1,235 | 237 | 4,255 |
FTE Pay Levels by Gender and Full-Time versus Part-Time Workers
Total - Male | |||
Pay Band | Part Time | Full Time | Total |
£1 - £10,000 |
|
|
|
£10,001 - £20,000 | 2 | 10 | 12 |
£20,001 - £30,000 | 36 | 439 | 475 |
£30,001 - £40,000 | 19 | 458 | 477 |
£40,001 - £50,000 | 21 | 495 | 516 |
£50,001 - £60,000 | 13 | 470 | 483 |
£60,001 - £70,000 | 14 | 123 | 137 |
£70,001 - £80,000 | 16 | 83 | 99 |
£80,001 - £90,000 | 4 | 117 | 121 |
£90,001 - £100,000 | 4 | 46 | 50 |
£100,001 - £110,000 | 2 | 13 | 15 |
£110,001 - £120,000 | 1 | 12 | 13 |
£120,001 - £130,000 | 2 | 21 | 23 |
£130,001 - £140,000 | 2 | 19 | 21 |
£140,001 - £150,000 |
| 6 | 6 |
£150,001 - £160,000 |
| 17 | 17 |
£160,001 - £170,000 |
| 2 | 2 |
£170,001 - £180,000 |
|
|
|
£180,001 - £190,000 |
|
|
|
£190,001 - £200,000 |
|
|
|
£200,000 + | 1 | 6 | 7 |
Total | 137 | 2,337 | 2,474 |
Total - Female | |||
Pay Band | Part Time | Full Time | Total |
£1 - £10,000 |
|
|
|
£10,001 - £20,000 |
| 1 | 1 |
£20,001 - £30,000 | 297 | 628 | 925 |
£30,001 - £40,000 | 216 | 906 | 1,122 |
£40,001 - £50,000 | 181 | 799 | 980 |
£50,001 - £60,000 | 112 | 636 | 748 |
£60,001 - £70,000 | 48 | 167 | 215 |
£70,001 - £80,000 | 33 | 75 | 108 |
£80,001 - £90,000 | 14 | 66 | 80 |
£90,001 - £100,000 | 7 | 19 | 26 |
£100,001 - £110,000 | 1 | 13 | 14 |
£110,001 - £120,000 | 1 | 11 | 12 |
£120,001 - £130,000 |
| 11 | 11 |
£130,001 - £140,000 |
| 4 | 4 |
£140,001 - £150,000 | 1 | 3 | 4 |
£150,001 - £160,000 |
| 3 | 3 |
£160,001 - £170,000 |
|
|
|
£170,001 - £180,000 |
| 1 | 1 |
£180,001 - £190,000 |
| 1 | 1 |
£190,001 - £200,000 |
|
|
|
£200,000 + |
|
|
|
Total | 911 | 3,344 | 4,255 |

SoJ Gender Pay
Currently, there are over 20 pay groups within SoJ with their own pay and terms and conditions of service. Within each pay group, the SoJ pay system covers employee grades ranging from junior roles with a relatively low level of responsibility, such as administrative- type roles, to managerial level. Each grade has a set pay range with a various numbers of increment points and some degree of overlap in between grades. Staff are expected to move through the pay range for their grade.
The SoJ pay approach supports the fair treatment and reward of all staff irrespective of gender within each of the pay groups. The longer period of time that someone have been on the grade the more we would expect them to earn irrespective of their gender.
The organisation is committed to protecting its workforce from all types of discrimination, ensuring that all employees are encouraged to develop to their full potential. The Equality and Diversity Policy currently in place was last reviewed in 2017 to ensure that its content is relevant within the current social, demographic and legal context in providing guidelines for a fair and inclusive treatment to all members of the workforce, service users, customers, contractors and volunteers.
Assumptions
Data included: salary data used for this report is based on employee full time equivalent basic pay as at 28 February 2017.
Gender Pay Gap
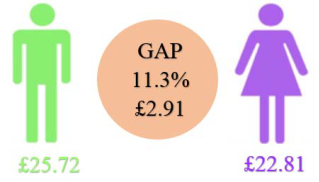
All Staff (Average)
Average hourly rate of pay and the percentage difference between them.

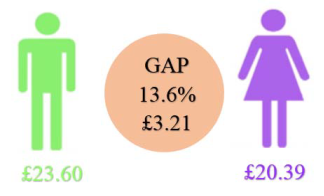
All Staff (Median)
Middle hourly rate of pay and the percentage difference between them.
Analysis of the States of Jersey overall gender distribution highlight a mean average difference of 11.3% and a median average difference of 13.6%, both in favour of men.
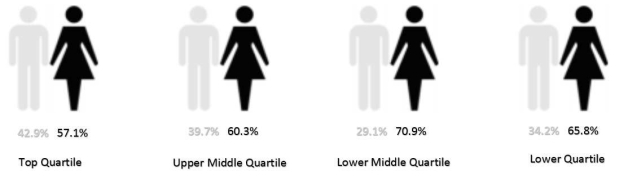
However, the figures go further to show that women make-up the majority of staff at all levels of the SoJ pay system with c.66% and c 71% at the lower quartile and middle lower quartile level, respectively and c. 60% and 57% at upper middle and top quartile level, respectively.