The official version of this document can be found via the PDF button.
The below content has been automatically generated from the original PDF and some formatting may have been lost, therefore it should not be relied upon to extract citations or propose amendments.
1240/5(4886)
WRITTEN QUESTION TO THE MINISTER FOR TREASURY AND RESOURCES BY DEPUTY G.P. SOUTHERN OF ST. HELIER
ANSWER TO BE TABLED ON TUESDAY 3RD NOVEMBER 2009
Question
"Will the Minister detail for members the "structural deficit" identified by his advisors for the year 2012 and beyond (following recovery from the economic recession) giving estimates of the total deficits identified and the contributions to such deficits from each of the potential sources of additional expenditure/reduction in revenues for the years 2012 to 2017?"
Answer
The updated financial forecasts are presented in the draft Budget Statement 2010 (P179/2009), on pages 10-15 as attached in Appendix 1. They were also the subject of a presentation to States Members on Monday 26 October. Although Deputy Southern did not attend the presentation, copies of the Budget Statement were posted, and the slides were emailed to Members who were unable to attend and are attached in Appendix 2.
The range of the possible financial position for the period 2009 to 2014 is that as shown the slides attached in Appendix 2. The central range forecast of the structural deficit for the period 2012 to 2014 ranges from £40 to £50m.
There is uncertainty in the forecasts, particularly based on the range of economic assumptions and the forecasts of the 0/10% loss. In 2012 the range between the optimistic and pessimistic scenarios is £60m and by 2014 this is almost £80m. For this reason it is not realistic to produce meaningful forecasts beyond 2014.
The principal contribution to the forecast deficits is the estimated reduction in income tax revenues. Looking ahead, with 50 percent of banks expecting profits to fall this year, primarily a result of exceptionally low interest rates and lower business volumes generally, tax revenue will fall. The structural deficit arises simply because the tax base will have shrunk and will take a number of years to recover whilst at the same time spending continues to rise in real terms.
APPENDIX 1
BUDGET STATEMENT 2010 EXTRACT – PAGES 10-15
FINANCIAL FORECAST
Background
The financial forecasts have been produced twice this year: in March to inform the Business Plan and the Fiscal Stimulus; and then in October to inform the Budget.
The forecasts in March showed a significant deterioration in the financial position from those produced in October 2008 for the 2009 Budget, the forecast deficit in 2010 increasing from £1 million to £51 million.
The latest forecasts reflect States expenditure approvals agreed in the recent Business Plan and a revised forecast of all States income. The economic assumptions on which the future forecasts are based have also been revised.
Analysis of the Forecast (October 2009)
Expenditure approvals
Since the draft Annual Business Plan 2010 was lodged in July the States has considered and approved the expenditure proposals, including some significant amendments. The approved spending levels for 2010 have increased by £1.6 million in revenue expenditure and £11.5 million for capital expenditure, so in total over £13 million. The Minister's intention is to reprioritise the indicative 2011-2014 capital programme to recover the additional expenditure and these proposals would form part of the 2011 Business Plan proposals.
In the case of the £1.6 million revenue expenditure the increases recur, so increasing the deficit in all future years, unless additional taxes are raised equivalent to this spending. The Minister is therefore proposing additional increases in impôts duty to fund these agreed increases in Health spending.
Not only have expenditure approvals for 2010 been exceeded but a number of additional expenditure approvals have been agreed in 2009 which draw down further funds from the Consolidated Fund, e.g. Reciprocal Health Agreement (£2.9 million), Historic Child Abuse Enquiry (£4.3 million), Pandemic Flu (£1.3 million), Williamson Review implementation (£1.3 million).
The new information available since the forecasts of States revenues were last prepared in March 2009 have identified a number of variations which are summarised as follows:
Income Tax
The income tax assessments for the current year are substantially complete and show that the expected receipts for 2009 are £14 million higher than forecast in March. The main driver of the improvement is better than expected performance from investment income. In terms of future years the forecasts are influenced by the latest economic assumptions and these are largely unchanged from those in March.
The main change since the March forecasts has been a review of the effect of the move to a 0/10% corporate tax structure. The review has been able to use the latest tax data on company profits and apply similar assumptions in respect of the relative effect on different companies of the new structure. The result of the review is that the effect of 0/10% in terms of the loss of corporate tax is likely to be less than previously forecast. This is primarily because company profits and therefore company tax have fallen with the downturn, so the loss of corporate tax to 0/10% has reduced proportionately.
Overall, taking into account a slightly improved starting position in 2009 and a reduction of the expected loss from 0/10%, the income tax forecasts have improved over the forecast period. However, it must be reiterated that there remains a high level of uncertainty within the forecasts based on the economic assumptions and the uncertainty about the scale and duration of the downturn.
![]() Goods and Services Tax (GST)
Goods and Services Tax (GST)
There is now a full year's data from the GST system and whilst it will be some time before any reasonable trends or seasonal variations are identified, the data on which to base the forecasts is now more complete. The first seven months of 2009 suggest that the forecast of £50 million for the first full year should be achieved. This suggests that the previous forecasts were robust and as predicted there will be only a limited effect of the downturn on what is essentially a consumption tax. This is also the trend seen in the UK in respect of VAT receipts in previous downturns.
![]() Impôts Duties
Impôts Duties
As with GST the importation and consumption of commodities subject to Impôts duties do not seem to have been materially affected by the downturn. The forecasts for 2009 are slightly better than in March, and, as a result of the proposals in this year's Budget, the forecasts for future years have increased.
The major change during 2010 will be the introduction of a Vehicle Emissions Duty, if agreed, this will provide a further £2 million of duty in a full year. It is assumed within the forecasts that the rates of alcohol duty growth are maintained above inflation and that the proposal to harmonise tobacco duty with the UK is followed through, as a result of this there is a further increase in the future forecasts.
Stamp Duty
The housing market has seen a significant reduction in the turnover of properties in the last twelve months, essentially from the second half of 2008. It had been expected that the reduced demand and turnover, coupled with a loss of confidence due to the downturn, would see house prices fall quite significantly as they have done in the UK. In fact the house price index has held up better than expected. Consequently the forecasts have been revised to reflect a much smaller fall in house prices. This factor combined with slightly better trends in 2009 to date have resulted in the stamp duty forecasts being revised upwards by as much as £5 million in each year.
2010 will see the introduction of a Land Transactions Tax (LTT), for which a cautious yield of £1 million has been estimated, as there is currently no data on the value or volume of share transfer residential property transactions available. Once LTT comes into force then statistics will be collected which will help future forecasting
Other Income
There are two main variations in the forecasts of other income. Firstly, there have been announcements relating to the automatic exchange of information. This will mean that the current revenue from EUSD Retention Tax of about £9 million will disappear from 2012, or maybe sooner. Although previously the forecasts had assumed a diminishing return as the level of retention tax increased, this is now a more significant loss of revenue in the next couple of years.
The other main variation in the forecasts is in respect of investment income from cash balances. This is the return from the investment of the States "current account", the Consolidated Fund, and also funds from the Currency and Coinage account. With interest rates at an all time low the investment income forecast has reduced. The size of the Consolidated Fund to invest has also reduced, mainly due to unplanned additional expenditure approvals in 2009. The reductions in Other Income forecasts partly offset the improvements in Stamp and Impôts duty revenues.
Overall Financial Position
The revised financial forecast at Figure 3.2 shows that notwithstanding the amendments to increase States expenditure in the business plan the financial position from 2010-2012 is little changed. In each of these three years there are significant deficits.
The financial position has improved in 2009 to a surplus of £55 million; this is before the Fiscal Stimulus. But, this is still £11 million down on the surplus expected in 2009, ahead of the move to 0/10% and predicted in the 2009 Budget.
The principal variation in the financial position is looking ahead to 2013 when the Island should be recovering from the downturn. In March the forecasts were for a possible structural deficit of between £50 million and £60 million, which has now reduced to between £40 million and £50 million.
However, there are still high levels of uncertainty in the forecasts and the achievement of the forecast financial position relies on States spending not increasing above the levels agreed by the States, which have not previously been adhered to. The forecasts also rely upon the Jersey economy continuing to show low levels of growth in what will be an uncertain global economy. In this context the views of the Fiscal Policy Panel are important in that they stress that most of the risks in relation to economic growth, tax revenues and from expenditure pressures are more likely to result in a deterioration of the forecast financial position rather an improvement.
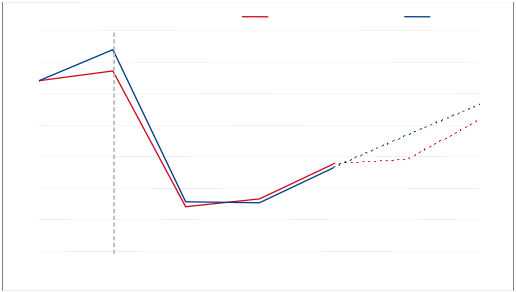
The graph at Figure 3.1 illustrates the change from the March forecasts used in the Business Plan and the potential range of outcomes over the forecast period.
Figure 3.1
Forecast Range of Outcomes for the Financial Position
Budget surplus/deficit, £m
50 0 -50 -100 -150
Optimistic/pessimistic scenarios |
|
|
|
2009 2010 2011 2012 2013 2014
![]() Stabilisation Fund
Stabilisation Fund
Following the agreed transfer of £63 million in 2009, the Stabilisation Fund has a balance estimated at £156 million. The States agreed a proposition in May to apply £44 million for a discretionary fiscal stimulus package and the balance of the Fund to be applied to enable public services to be maintained as States revenues are reduced during the downturn and additional expenditure on benefits is required. According to the latest forecast £37 million will be required in 2010 with a further transfer of £68 million required in 2011, after which the Stabilisation Fund will be almost exhausted.
Consolidated Fund
The Consolidated Fund, the States "current account", has in recent years been in surplus and has provided sums to establish and top-up the Stabilisation Fund. This was part of an agreed counter-cyclical policy. The Fiscal Policy Panel has commented that a minimum working balance of £20 million be retained in the Consolidated Fund to provide for unforeseen items and manage variations in States revenue forecasts. In 2009 for example, there have been significant approvals under Article 11(8) amounting to £18 million.
At the end of 2010 there will be an estimated balance of £20 million. After the Stabilisation Fund is exhausted in 2011 only a small balance, estimated at £20 million will remain in the Consolidated Fund against a predicted deficit in 2012 of £50 million. If no action is taken then the Consolidated Fund would be overdrawn. The Public Finances (Jersey) Law 2005 does not allow a budget to be set projecting the Consolidated Fund as overdrawn. The Fiscal Strategy Review will need to identify options to implement as early as 2012 to address the potential structural deficit.
Figure 3.2 Revised Financial Forecast (October 2009)
Probable |
| <---------- | Forecasts --------------> |
2009 |
| 2010 | 2011 2012 |
£m |
| £m | £m £m |
| States Income |
|
|
499 (11) | Income Tax 0/10% Corporate Tax Structure | 472 (81) | 469 495 (78) (82) |
50 | Goods and Services Tax | 51 | 52 54 |
51 | Impôts Duty Proposed Environment Tax | 52 2 | 55 55 2 2 |
19 | Stamp Duty Land Transaction Tax (Share Transfer) | 21 1 | 22 24 1 1 |
34 | Other Income | 29 | 30 29 |
11 | Island Rate | 11 | 11 12 |
| States Income |
|
|
653 | 558 | 564 590 | |
|
|
| |
| States Expenditure |
|
|
542 | Net Revenue Expenditure | 586 | 611 620 |
18 38 | Additional expenditure Net Capital Expenditure Allocation | 32 | 21 19 |
| Total States Net Expenditure |
|
|
598 | 618 | 632 639 | |
|
|
| |
| |||
55 | Forecast Surplus/(Deficit) for the year (60) (68) (49) | ||
|
| ||
Assumptions:
There are a number of assumptions behind the financial forecasts in Figure 3.2.
Income Tax
• The base income tax forecasts are drawn from the 2009 tax assessments for earnings and profits in 2008 and the current economic assumptions for GVA and other factors.
• The impact of the change to a corporate structure 0/10% has been reviewed and is based on the most recent and reduced corporate tax revenues. The latest range is £73 million to £97 million, the
mid-point of this range is £85 million in 2013, and a revised profile over the years 2009 to 2013 is included in these forecasts. The income tax forecast model is used to apply the range of economic assumptions to the current data from the different income tax schedules to estimate a range of impact of the economic
downturn and future tax revenues. The range of income tax forecast from optimistic to pessimistic is £17 million in 2010 and £49 million in 2013.
Goods and Services Tax
• The forecast is based on only one year's data and therefore assumes that the profile of current revenues is repeated in future years.
• The future forecasts assume there will be little or no impact of the downturn and this is supported by the UK experience of stable VAT receipts during past economic downturns.
Impôts Duty
• The impacts of the 2010 Budget proposals are included in the forecast including the proposed introduction of Vehicle Emissions Duty (VED) from September 2010.
• The forward forecasts reflect the proposed policy to harmonise tobacco duty with UK tax and duty rates over the next three to four year.
• The forecasts assume that the predicted trends in consumption are maintained, which include a drop off for some goods, but also include an assumption that there would be annual increases in
duty at a level equivalent to the Island RPI. There is an economic assumption that impots duties are based on consumption and that there will be no material effect of the economic downturn on future revenues.
Stamp Duty
• The forecasts reflect the reduced activity seen in 2009 and assume this will continue into 2010.
• The assumption regarding house prices has been amended to reflect the house price trend in 2009 and only a small fall-off in price in 2010. Any recovery in the housing market both in price and activity
is expected to be slow. The estimated impact of the new Land Transactions Tax in 2010 is assumed to collect £1 million.
Other Income
• At the time of the Stimulus in March 2009 the assumption was that the effect of a fall in interest rates would not impact quite as significantly as they have. This is compounded by slightly larger
deficits in 2010 and a slight fall in the projections for investment income. The base assumption is to achieve a small margin on the Bank of England forecast interest rate. Island Rate The Island Rate will increase annually according to the Island RPI (March) as prescribed in the Rates Law and the proposed rate is reported annually to the States by the Comité de Connétable s. There should be no effect of the economic downturn on Island Rates.
Total States Net Expenditure
• The forecasts for total States net expenditure have been updated for the proposals in this Business Plan and reflect the amendments agreed during the debate for additional funding.
• The forecasts include the £1.6m additional net revenue expenditure allocation for Health and Social Services and the Capital Expenditure includes the amendments amounting to £11.5 million in
respect of Town Park, Bellozanne Odour Control and the Eastern Cycle track. The forecasts assume that the total spending envelope, agreed in the Business Plan, is adhered to. Revised Forecast Surplus/(Deficit) The figures should be thought of as indicative forecasts and are only as accurate as the assumptions they are based on. The deficits resulting from the range of economic assumptions
reflect the uncertainty that currently exists.
![]() Fiscal Stimulus Package - The approval of P55/2009 for £44 million spending approval for the Minister and Treasury and Resources to allocate for Fiscal Stimulus will be matched by an equivalent transfer from the Stabilisation Fund. While the spending approval by the States for £44 million is made in 2009 the actual profile of the project spending will take place over 2009 to 2011.
Fiscal Stimulus Package - The approval of P55/2009 for £44 million spending approval for the Minister and Treasury and Resources to allocate for Fiscal Stimulus will be matched by an equivalent transfer from the Stabilisation Fund. While the spending approval by the States for £44 million is made in 2009 the actual profile of the project spending will take place over 2009 to 2011.
APPENDIX 2 PRESENTATION SLIDES EXTRACT
Income tax forecast
 £mn Business Plan Now
500
+£14m
480
460
440
420
+£3m -£2m 400
-£2m
380
360
2008 2009 2010 2011 2012 2013 2014
Budget year [tax received]
![]() • Differences since Business Plan are shown
• Differences since Business Plan are shown
Variance from Business Plan forecasts
 2009 2010 2011 2012 £m £m £m £m
![]()
![]()
![]() Income tax 14 3 (2) (2) Other income 1 2 7 11 Expenditure (1) (13) (2) (2)
Income tax 14 3 (2) (2) Other income 1 2 7 11 Expenditure (1) (13) (2) (2)
![]() Change in Surplus/(Deficit) 14 (8) 3 7
Change in Surplus/(Deficit) 14 (8) 3 7
 Probable Forecasts
2009 2010 2011 2012 £m £m £m £m
![]() 653 States Income 558 564 590
653 States Income 558 564 590
![]() 598 States Net Expenditure 618 632 639
598 States Net Expenditure 618 632 639
![]() 55 Surplus/(Deficit) (60) (68) (49)
55 Surplus/(Deficit) (60) (68) (49)
![]()
Consolidated Fund Forecast
 Probable Forecasts
2009 2010 2011 2012 £m £m £m £m
![]() 51 Opening balance 43 20 20
51 Opening balance 43 20 20
![]() 11 Surplus/(Deficit) (60) (68) (49)
11 Surplus/(Deficit) (60) (68) (49)
![]() (19) Stabilisation Fund 37 68 7
(19) Stabilisation Fund 37 68 7
![]() 43 Estimated closing balance 20 20 (22)
43 Estimated closing balance 20 20 (22)