The official version of this document can be found via the PDF button.
The below content has been automatically generated from the original PDF and some formatting may have been lost, therefore it should not be relied upon to extract citations or propose amendments.
1240/5(4509)
WRITTEN QUESTION TO THE MINISTER FOR TREASURY AND RESOURCES BY THE DEPUTY OF ST. MARY
ANSWER TO BE TABLED ON TUESDAY 19th MAY 2009
Question
"In the interests of transparency before the Strategic Plan debate, will the Minister –
- a d vise on the proportion of GDP (or other measure of overall wealth) which consisted of government expenditure of all kinds in the last year forwhich full figures areavailableand for whichthecomparisonsinb)below are available, and how that is funded – tax receipts, social security, borrowing, etc.? and;
- a d vise whether the Treasury has figures forsomecomparable European jurisdictions, ensuring that they are,asfaraspossible,comparing like forlike,and,ifso, would the Minister set out those figures, giving clear details to members on the difficulties inherent in making such comparisons andofthe caveats ofwhichmembersshould be aware, such as expenditure on defence (which does notapply to Jersey) how socialsecurityand health are dealtwithand paid for, and so on?"
Answer
The latest information as on government expenditure as a proportion of GNI was published by the Statistics Unit in the September 2007 release on GVA and GNI. The information from that report is reproduced below.
The breakdown of States income is shown in the chart below: States' income by source (% of total), 2008
Self employed and
investment holders Departmental income
5%
14%
Salary and wage earners
30%
Impôts Income Tax
7% 65%
Companies Other income 30%
6%
GST 4%
Stamp duty 3%
Island rate 1%
Source: States of Jersey Treasury and Resources Department.
Extracts from Statistics Unit report
An internationally comparable benchmark for governments worldwide is the proportion that government expenditure represents of GNI. Using the GNI figures for Jersey shown in Table 2 it is possible to compare government expenditure in total and separately on education, public health and social benefits as a percentage of GNI with that of OECD member states. This has been done for the latest year for which comparable data are available: comparison with OECD averages is shown in Table 7 and with individual states in the Appendix (Table A1 and Figures A1 and A2). The percentages for Jersey for the period 2001 to 2006 are also shown in Table A2.
Table 7 – Government expenditure as a percentage of GNI for Jersey and the OECD
 General Government Education Public Health Social benefits Expenditure (GGE), 2005 2003 2004 2005
Jersey 26% 3.3% 5.1% 6.9% OECD average 44% 5.3% 6.4% 13%
Percentages are shown to two significant figures. For definitions of expenditure categories see Appendix.
As a result of Jersey's relatively large GNI per capita, government expenditure in the Island, expressed as a percentage of GNI, is considerably less than that of most OECD states, ranging from about half of the OECD average percentage level in the case of social benefits to about four-fifths for public health. Total government expenditure in Jersey in 2005 was about three-fifths of the OECD average, as a percentage of GNI.
Table A1 - International comparison of government expenditure.

 General Government Education Public health Social benefits Expenditure (GGE) 2005 2003 2004 2005
Jersey 26% 3.3% 5.1% 6.9% Australia * & 35% 4.5% 6.7% 8.5%
Austria 49% 5.1% 6.7% 18.5% Belgium 50% 5.6% 6.8% 15.8%
Canada * ^ & 41% 5.1% 7.0% 10.3% Czech Republic * & 45% 4.4% 6.6% 12.2%
Denmark 53% 8.1% 7.2% 16.3% Finland 51% 6.3% 5.6% 16.6%
France 53% 5.7% 8.5% 17.7% Germany 47% 4.5% 8.1% 19.1% Greece 37% 3.2% 4.2% 13.2% Hungary 53% 5.8% 5.9% 15.4% Iceland 46% 7.7% 8.7% 9.3% Ireland * & 40% 5.0% 6.6% 10.6% Italy 49% 4.7% 6.7% 17.4% Japan * # & - 3.6% 6.2% 10.9% Korea * & 28% 4.8% 2.8% 2.5%
Luxembourg ^ 51% 3.8% 8.6% 17.3% Mexico& - 5.8% 3.1% 1.8%
Netherlands 44% 4.6% 5.5% 10.8% New Zealand *& 39% 6.8% 6.9% 11.0%
Norway 39% 7.1% 7.9% 12.4% Poland * 43% 5.6% 4.4% 16.0% Portugal 48% 5.9% 7.0% 15.0%
Slovak Republic * # & 39% 4.2% 4.7% 10.1% Spain 39% 4.0% 5.8% 11.8% Sweden 58% 7.0% 7.7% 17.8%
Switzerland * & 34% 5.1% 6.3% 11.2% Turkey - 3.8% 5.8% .. United Kingdom 43% 5.1% 6.7% 12.8%
United States * & 37% 5.7% 6.9% 12.0% OECD average 44% 5.3% 6.4% 12.9%
* Total general government expenditure for Australia, Canada, Czech Republic, Ireland, Japan, Korea, Poland, Slovak Republic, United States is for 2004, Switzerland for 2003 and New Zealand 2002.
# Health Expenditure for Japan and Slovak Republic is 2003 data.
^ Education expenditure for Canada is for 2002, and Luxembourg for 2001.
& Social benefits expenditure for Australia, Canada, Czech Republic, Ireland, Japan, Korea, Slovak Republic and the United States is for 2004, Switzerland for 2003 and Mexico and New Zealand for 2002. Sources: The Treasurer of the States Financial Report and Accounts, 2000-2005;
GVA and GNI 1998-2005, Statistics Unit, States of Jersey;
OECD in Figures 2006-2007.
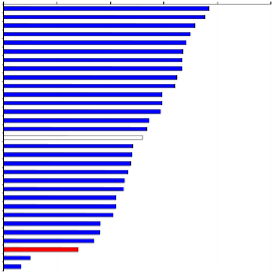
Figure A1 –Government Expenditure: in Total and on Social Benefits, 2005: % of GNI.
GGE as % of GNI
0 10 20 30 40 50 60 70
Sweden Denmark
|
|
|
|
|
|
| ||
|
|
|
|
| ||||
|
|
|
|
| ||||
|
|
|
|
| ||||
|
|
|
|
| ||||
|
|
|
|
| ||||
|
|
|
|
| ||||
|
|
|
|
| ||||
|
|
|
|
| ||||
|
|
|
|
| ||||
|
|
|
|
| ||||
|
|
|
| |||||
|
|
|
| |||||
|
|
|
| |||||
|
|
|
| |||||
|
|
|
| |||||
|
|
|
| |||||
|
|
|
| |||||
|
|
|
| |||||
|
|
|
| |||||
|
|
|
| |||||
|
|
|
| |||||
|
|
|
| |||||
|
|
|
|
| ||||
|
|
| ||||||
|
|
| ||||||
|
|
| ||||||
|
|
| ||||||
France Hungary
Luxembourg Finland
Belgium Austria
Italy Portugal
Germany Iceland
Czech Republic (2004) Netherlands
OECD average United Kingdom Poland (2004)
Canada (2004) Ireland (2004)
Slovak Republic (2004) Norway
Spain New Zealand (2002) Greece
United States (2004) Australia (2004) Switzerland (2003) Korea (2004) Jersey
Social benefits paid as % of GNI
0 5 10 15 20 25
 Germany Austria France Sweden
Italy Poland (2004) Greece Finland Denmark Belgium Portugal Hungary
Luxembourg
Norway
United Kingdom
OECD average ![]() Switzerland (2003)
Switzerland (2003)
United States (2004)
Czech Republic (2004)
Spain Japan (2004) Netherlands
New Zealand (2002) Slovak Republic (2004)
Canada (2004) Iceland
Ireland (2004) Australia (2004) Jersey
Korea (2004) Mexico (2002)
Figure A2 - Government expenditure on Education (2003) and Health (2004): % of GNI.
Education: % of GNI
0% 1% 2% 3% 4% 5% 6% 7% 8% 9% 10%
Denmark Iceland
|
|
|
|
|
|
|
|
|
| |
|
|
|
|
|
|
|
| |||
|
|
|
|
|
|
| ||||
|
|
|
|
|
| |||||
|
|
|
|
|
| |||||
|
|
|
|
|
| |||||
|
|
|
|
|
|
| ||||
|
|
|
|
| ||||||
|
|
|
|
| ||||||
|
|
|
|
| ||||||
|
|
|
|
| ||||||
|
|
|
|
| ||||||
|
|
|
|
|
| |||||
|
|
|
| |||||||
|
|
|
| |||||||
|
|
|
| |||||||
Norw ay Sw eden
New Zealand Finland
Mexico Hungary France
United States Portugal Belgium
Poland OECD average A ustria
Canada 2002 United Kingdom Sw itzerland Ireland
Korea Italy Netherlands Germany
A ustralia Czech Republic Slovak Republic Spain
Turkey Luxembourg Japan Jersey Greece
Table A2 - Government expenditure as a % of GNI in Jersey: 2001 – 2006 (current year values)
2001 2002 2003 2004 2005 2006
GNI (£ m illion) | 2,900 | 2,930 | 2,970 | 3,030 | 3,180 | 3,440 |
GGE % G N I | 27% | 27% | 26% | 27% | 26% | 25%. |
Education % G N I | 2.8% | 3.2% | 3.3% | 3.5% | 3.4% | 2.8% |
Health % G N I | 4.2% | 4.6% | 5.0% | 5.1% | 5.1% | 4.8% |
Social Benefits % G NI | 6.0% | 6.5% | 6.8% | 7.1% | 6.9% | 6.7% |
Percentages are shown to two significant figures. Definitions
- TheOrganisationforEconomicCo-operationandDevelopment (OECD) is an international organisation with 30 member states. All OECD averages shown are unweighted mean averages of numbers presented in the tables of this Appendix.
- GeneralGovernmentExpenditure (GGE) for OECD member states includes central, state/regional and local government authorities. For Jersey, general government expenditure is taken to be the sum of: total expenditure shown in the Total Income and Expenditure Account of the Financial Report and Accounts published by the Treasury and Resources Department; capital expenditure; and all social benefits paid (tax-funded, paid from social security and health insurance funds, Parish welfare, rent rebate and rent abatement).
- Government expenditure on Education in OECD countries includes current and capital expenditure on primary, secondary, post-secondary non-tertiary and tertiary education institutions for the purchase of education resources, payments of teachers' salaries and maintenance of buildings. Expenditure on education also includes public subsidies to households comprising grants/scholarships and student loans. Ancillary services are services provided by educational institutions that are peripheral to the main educational mission and are incorporated in expenditure. Ancillary services consist of, for example, meals, counselling, transportation, halls of residence, dining halls, health care, museums, broadcasting, sports and cultural programmes which are provided by the educational institutions. Public funds capital formation on education, e.g. investment in building new institutions plus capita transfers for construction and equipment, is included in general government expenditure on education. For Jersey, estimates have been calculated to match the OECD definition of government expenditure for the Education component of the Education, sport and culture department.
- General government expenditure on Health refers to health expenditure on non-market, non-profit institutions incurred by public funds. Public expenditure includes services of curative, rehabilitation and long term care also ancillary services such as administration, emergency rescue, prevention and public health. Current expenditure on public health excludes social security schemes, cash benefits, environmental health, research and training. Public funds capital formation on health, e.g. investment in health facilities plus capita transfers for hospital construction and equipment, is included in general government expenditure on health.
To correspond with the OECD definition, government expenditure on health in Jersey includes public health, medical, surgical, mental health, ambulance and social services.
- Expenditure on Social benefits covers government spending for risks or needs such as sickness, disability, old age and unemployment. For OECD states such spending is classified in the national accounting framework as "social benefits other than social transfers in kind" and "social transfers in kind related to expenditure on products supplied to households via market producers". The UK records a negligible amount under the latter category whilst the Netherlands, for example, records a high amount (18% of total government expenditure in 2005).
For Jersey, social benefits paid by government include those from tax-funded sources, social security and health insurance funds, Parish welfare, rent rebate and rent abatement.