The official version of this document can be found via the PDF button.
The below content has been automatically generated from the original PDF and some formatting may have been lost, therefore it should not be relied upon to extract citations or propose amendments.
4.7 Stream Macroinvertebrate (Biological) Monitoring by Environmental Protection
Executive Summary
- Following the 2007-2009 quinquennial review period, 47% of sites have achieved a Jersey equivalent of high/good ecological status (the target status under the Water Framework Directive).
- Biological monitoring allows Environmental Protection to measure the ecological impact of pollution on controlled waters.
- This programme is currently being rationalised following completion of 2007- 2009 quinquennial review project.
- Overview of the monitoring programme
In 1996, the first systematic investigation of the biological water quality of Jersey streams was conducted. It has long been recognised that macroinvertebrate monitoring provides an effective means of distinguishing water quality, and using the condition of biological communities to assess the ecological quality of surface water bodies is a core concept of the Water Framework Directive.
Between 1996 and 2010, 58 sites have been monitored from 10 of the Island's catchments. Initially sampling frequency was set in order to collect sufficient baseline data on each site. This allowed inter-seasonal and inter-annual variability to be assessed. Following the 2007-2009 quinquennial review period, 47% of sites have achieved a Jersey equivalent of high/good ecological status (the target status under the Water Framework Directive). This is an 11% increase over the period 1998-2004.
- Legislation
Article 7 of Water Pollution (Jersey) Law requires the Minister to monitor controlled waters. Biological monitoring is a fundamental part of the monitoring programme allowing Environmental Protection to measure the ecological impact of pollution on controlled waters.
Although Jersey is not obliged to comply with the provisions of the Water Framework Directive, the States of Jersey have an undertaking to achieve EU Standards where possible. The spirit of parts of the Directive have also been incorporated into the Water Pollution (Jersey) Law, 2000 through Part 3 which introduces the concept of Water Catchment Management Areas and allows Water Quality Objectives (WQOs) to be set.
In order to be in a position to implement the broader requirement of the Water Framework Directive that water bodies should achieve "good" ecological status, Environmental Protection in conjunction with Ecoscan Environmental Services (the auditor for this programme) devised a classification scheme for Jersey streams. Te classification defines five water categories that mirror the classification sytem used by the Environment Agency, The Scott ish Environment Protection Agency, and the Water Framework Directive. It also contains a further category for heavily modified water bodies again following the Water Framework Directive.
- Stakeholders
The programme was originally overseen by Middlesex University. Environmental Protection Officers are now able to identify macroinvertebrates to family level and conduct the field work, sampling and identification in house.
Ecoscan Environmental Services in collaboration with Middlesex University have historically carried out audits of each sample run. This consists of 10% or a minimum of 20 samples per year. In practice, 10 sites are chosen randomly from each of the spring and autumn runs.
A review of the programme is currently being undertaken following the completion of the last quinquennial review. The programme moving forward is likely to concentrate on the poorer quality sites, introduce new sites and incorporate pond sampling.
The information/data generated by the programme is principally used by Environmental Protection for its various responsibilities under the Water Pollution (Jersey) Law, 2000.
Working in partnership with the Ecology Section of the Environment Division on pond sampling will provide this section with valuable information for the protection of Sites of Special Interest.
The information is also relevant to external stakeholders, such as Jersey Water, The National Trust and other environmental interest groups.
- Monitoring undertaken by Environmental Protection
The full sampling protocol is included in an appendix to this document. Environmental Protection measure the following relevant field parameters - pH, conductivity, water temperature, air temperature, calcium, alkalinity, flow rate, stream dimensions, cloud cover etc. A filtered sample is collected for subsequent calcium analysis by the States of Jersey Official Analyst. All the other parameters being measured in the field using field kits.
Following sorting of the sample, the following biological indices/parameters are calculated – BMWP (Biological Monitoring Working Party Score), ASPT (Average Score per Taxa), OQR (Overall Quality Rating) and LQI (Lincoln Quality index). Further details on how to calculate these are included in the appendix.
Samples are collected in the following catchments: Bellozanne Valley
Mourier Valley
St Catherines woods (Rozel)
Waterworks Valley
Queens Valley
Pres D'Auvergne
Longueville
St Peters Valley
Grand Vaux
Vallee des Vaux
St Brelades
Plemont
Vaux De Lecq
Bouley Bay
Bonne Nuit
Macroinvertebrate work is undertaken in the Spring and Autumn for a period of two weeks in each season. The results of each season are combined to calculate annual indices. In the summer, Environmental Protection spends 2-3 days sampling additional pond work.
Field data is stored in two places, the central WQMIS database and an addition "Water Resources Section Biological Monitoring Tool". This tool is a Jersey equivalent of TWINSPAN and was developed with Ecoscan Environmental Services to classify local stream types, record all data and allow comprehensive data interrogation.
- Auditing procedure
This has been achieved over the years through the development of a close, collaborative working partnership with Middlesex University and Ecoscan Environmental Services who provide a quality assurance service for the programme through the following means:
- Ensuring that sampling is carried out in accordance with Freshwater Biological Association protocols
- Assisting with sampling and identification of macroinvertebrates and checking unknowns
- Carrying out an audit of 10 samples per season involving re-examining the samples and reporting on extraction efficiency and sample accuracy
- Providing in-house training for Environmental Protection.
- Providing an advisory service throughout the year for non-standard sampling, for example following pollution incidents.
The services being provided by both bodies are currently being reviewed in light of the completion of the quinquennial review and the rationalisation of the programme as a whole.
- Reporting
The following reports are available (these are in addition to Environmental Protection's annual audit reports):
- January 1999 – An Independent Assessment of the Effect of Season on Biological Water Quality of Jersey Freshwater Streams. Interim Report (Autumn 1997 – Summer 1998)
- August 1999 – An Assessment of Biological Water Quality of Jersey Freshwater Streams1997/1998: the Effect of Seasonal Variation. Final Report (1997 & 1998).
- August 2001 – Biological Water Quality of Jersey Freshwater Streams: Inter-seasonal and Inter-annual Variation. (1997 – 1999)
- August 2003 – Towards Water Quality Objectives
- February 2004 – An Assessment of Water Quality Objectives.
- February 2005 – Quinquennial Review of Jersey Flowing Waters (1998 – 2004)
- June 2010 - Quinquennial Review of Jersey Flowing Waters (2005 – 2009)
- Budget, manpower and resources considerations
Sampling requires two people. In general, once the samples are brought back to the lab any trained members from Environmental Protection will assist the samplers in the sorting of the samples to ensure they are done as quickly as possible. With ever increasing workloads this is becoming more difficult. Fortunately, two members of the team are highly experienced and in house development of rest of the team is an ongoing process. The risk is of course if one of the two members leaves the department or is absent during the sampling runs the pressure on the rest of the team will increase significantly.
The total cost for the three-year quinquennial review was £48,551.89
A breakdown of these costs over the four year invoicing period is as follows:
Ecoscan Environmental Services
2007 Spring 2007 audit: £5206
2008 Autumn 2007/ Spring 2008 audit: £10412
2009 Autumn 2008/Spring 2009 audit: £10412
2010 Autumn 2009 audit and quinquennial review: £10413
Middlesex University
2007 Project design plus Spring audit £2968
2008 Autumn 2007/Spring 2008 audits £1662
2009 Autumn 2008/Spring 2009 audits £1662
2010 Autumn 2009 audit plus quinquennial review £5817
The ongoing rationalisation of this project to a monitoring programme more in line with existing programmes is likely to result in significant cost savings. The auditing procedure will be streamlined, with new sites added and pond work commenced.
Appendix 1 MACROINVERTEBRATE SAMPLING PROTOCOL
In the field:
- Identify the 20 metre stretch of stream. If it is a site that has been sampled before check the previous Field Record Sheet for the exact sampling position (if necessary check the grid references). Measure out the 20m stretch of stream.
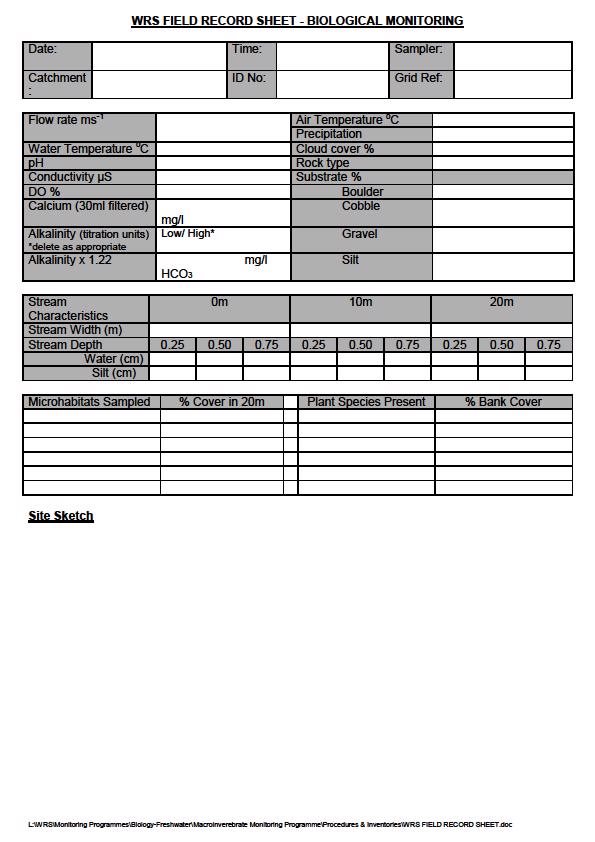
- A Field Record Sheet should be completed for each site. Begin with site ID number, date, time, site name and initials of samplers.
- A clear and concise site map should be completed for each site (if the site has not changed considerably since the last sampling occasion the map can afford to be less detailed – if this is the case please indicate so on the Field Record Sheet). The map should show macrophytes (plant cover including roots etc. in the stream) riffle, slack, depositing, pool, run, eroding and canalised microhabitats. Also include % canopy cover, a note on the type of landscape the stream is in i.e. grazed meadow, if any pipes enter the stream, note is anything is being discharged through them and mark their positions on the field sketch.
- Perform required field tests (alkalinity, conductivity, DO, pH, temperature, flow rate etc). Perform each test in duplicate and record the results. Take a 30ml filtered sample in a universal tube for calcium analysis. Important to perform chemical tests before disturbing the stream bed. Record the air temperature and cloud cover (%).
- Measure the dimensions of the stream at 0m, 10m, and 20m. Record the stream width (water edge to water edge). Measure the depth of the water and silt at 25%, 50% and 75% of the stream width. Record these measurements. All "Stream Characteristics" measurements are taken with the "0m" column denoting the "start" point on the sketch map. All depth figures are taken starting from the stream bank that is drawn nearest to the bottom of the field sheet. If the silt depth includes the water depth, put this figure in brackets.
- Choose a representative 1m2 of substrate (streambed) and calculate the percentage cover of each type of substrate (including macrophyte if there is a small amount).
- Collect a sample of the macroinvertebrates living within the stream by using the kick method and a pond net. Split the three-minute sampling time according to the percentage cover of each substrate or habitat type (as calculated in 6. above). If there is a large amount of macrophyte this must be given it's own time allocation. Always start the kick sample at the furthest point downstream and work your way upstream. This means that you may start sampling at the 20m mark and work backwards.
- Rinse as much silt from the sample as possible and carefully place your sample into a bucket/container. Pour some fresh water in so that it covers and protects some of the more delicate specimens. Place a lid/cover over the top and ensure the sample is labelled ready for transport to the laboratory.
- If there are boulders or large cobbles that were too large to enter the net these should be "turned" and any specimens collected. Spend 1 minute looking under stones at the end of the 3-minute kick sample. If it is an audit site all macroinvertebrates found on stones should be placed in a labelled 30ml universal tube and brought back with the sample. If it is not an audit site, the families found on stones can be identified in the field, recorded on the field sheet and then returned to the stream.
Laboratory Analysis of Macroinvertebrate Samples
Macroinvertebrates are sorted from the vegetation and identified in the laboratory using dissecting microscopes, with the FBA identification guides: Gastropoda [snails] (Macan, 1977), Hirudinea [leeches] (Elliot and Mann, 1979), Malacostraca [Crustacea] (Gledhill et al.,1976), Ephemeroptera [mayflies] (Elliot et al., 1988), Plecoptera [stoneflies] (Hynes, 1977), Hemiptera [bugs] (Savage, 1989), Trichoptera [caddis flies] (Wallace et al.,1990, Edington and Hildrew, 1981), the AIDGAP Key to adult Coleoptera [water beetles] (Friday, 1988), and Hammond (1983) for Odonata [dragonand damselflies]. All macroinvertebrates were identified to Family except Oligochaeta [worms].
BMWP scoring taxa are entered on the WRS Field Record Sheets, together with comments on whether the taxa are dead upon sampling and an indication of abundance for those taxa represented. Non-scoring taxa (aquatic, semi-aquatic and terrestrial) are also noted on the recording sheets.
Field sheets also indicate which taxa had been included in specimen tubes, by insertion of an asterisk next to the taxon.
The ten samples chosen for audit are preserved in 1.5% Propylene Phenoxetol and stored in a refrigerator. Where samples contained a large amount of substrate/leaf litter, samples are subdivided into separate bottles. Prior to sending samples for audit, the preservative is renewed and the sample bottles topped up. For each sample, delicate or rarer macroinvertebrates are removed and put in a tube (placed within the sample bottles). These specimens are fixed in 4% formalin overnight. Fixed taxa are then preserved in 1.5% Propylene Phenoxetol. Samples are refrigerated throughout.
Water Quality - using Macro-invertebrate Data:
After sample collection, sorting and identification the results can be used to obtain an idea of water quality. The following techniques can be used on data from flowing streams:
BMWP (Biological Monitoring Working Party):
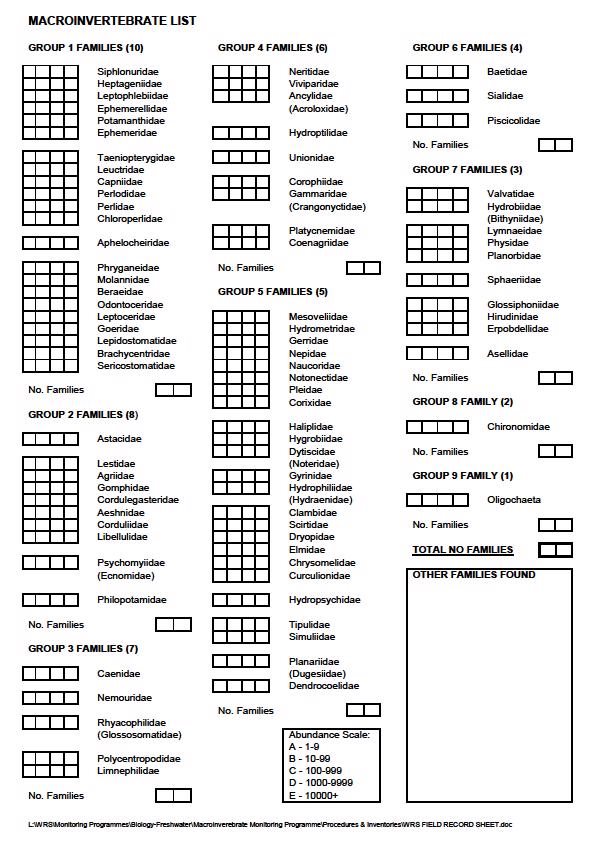
From 1977-1980 the Freshwater Biological Association (FBA), in association with the water authorities and the Nature Conservancy Council developed a national rivers classification dependent upon the occurrence of larger invertebrate animals (macroinvertebrates). This was then refined by the Biological Monitoring Working Party (BMWP) (Chesters, 1980), to provide values to the families of aquatic macroinvertebrates depending on their tolerance of organic pollution. The sum of the values of families found at each site is known as the BMWP score and equates to the 1a, 1a, 2, 3, 4 river categories of the National Water Council (NWC) classification.
Each of the families (except Oligochaeta which are identified to Class) is assigned a score between 1 and 10 depending on their tolerance to organic pollution. The sum of these values is the BMWP score which ranges from 0 –151+ and are usually grouped into categories which broadly designate water quality. The higher scores indicating habitat richness/larger rivers.
151+ | Very high quality |
101-150 | High water quality |
51-100 | Good water quality |
17-50 | Moderate water quality |
0-16 | Poor water quality |
How to calculate BMWP:
- Add up the number of families present in a group and place this number into the "No. families" box at the end of each group.
- Multiply this number by the score for the group - this is in brackets after the group title. E.g. If there are three families present from Group 6', each family carries a score of 4 so the score for Group 6' is 12.
- Repeat this for each group and the sum of the values from each group gives you your "BMWP".
ASPT (Average Score per Taxon):
This has been shown to be a more robust indicator of water quality as it is more independent of operator bias and seasonal variation. Adhering to the standard operating procedures (SOPs) should help comparability of samples however the ASPT calculation should help eliminate variations of this kind.
Values for ASTP range from 0 – 6.0+, the higher the value the better the quality of the stream.
How to calculate ASPT:
- Calculate your "Total No.of Families" by adding up the number of families in each group. The sum of these figures gives you your "Total No.of Families".
- Divide your "BMWP" by the "Total No.of Families" contributing to the score to give you your "ASPT"
OQR(Overall Quality Rating) and LQI (Lincoln Quality Index):
The majority of Jersey's streams are less than 2m wide and it is generally inappropriate to compare streams of this size to large rivers such as the Thames. Larger streams and rivers have more habitats in the 20m stretch of water used for sampling. The variation in habitat richness related to size/width can be taken into account by using the Lincoln Quality Index (developed by Anglian Water) {Extence et.al., 1987} which modifies the BMWP and ASPT scores according to habitat rich riffle sites (waterways >2m wide) and habitat poor riffle sites (<2m wide). Each BMWP and ASPT category is given a rating (see below). The average of these ratings is used to provide the LQI (via the Overall Quality Rating, OQR).
This is done using the following tables:
OQR for habitat rich sites greater than 2m wide:
BMWP | RATING X | ASPT | RATING Y |
151+ | 7 | 6.0+ | 7 |
121-150 | 6 | 5.5-5.9 | 6 |
91-120 | 5 | 5.1-5.4 | 5 |
61-90 | 4 | 4.6-5.0 | 4 |
31-60 | 3 | 3.6-4.5 | 3 |
15-30 | 2 | 2.6-3.5 | 2 |
0-14 | 1 | 0.0-2.5 | 1 |
OQR for habitat poor sites less than 2m wide:
BMWP | RATING X | ASPT | RATING Y |
121+ | 7 | 5.0+ | 7 |
101-120 | 6 | 4.5-4.9 | 6 |
81-100 | 5 | 4.1-4.4 | 5 |
51-80 | 4 | 3.6-4.0 | 4 |
25-50 | 3 | 3.1-3.5 | 3 |
10-24 | 2 | 2.1-3.0 | 2 |
0-9 | 1 | 0.0-2.0 | 1 |
The appropriate table is chosen depending on stream width and the BMWP and ASPT values are entered into the table (see above). The X and Y ratings are used to obtain the OQR.
OQR = (X + Y)/2
The OQR is entered into the table below to give the LQI
OQR | LQI | Interpretation |
6+ | A++ | Excellent quality |
5.5 | A+ | Excellent quality |
5 | A | Excellent quality |
4.5 | B | Good quality |
4 | C | Good quality |
3.5 | D | Moderate quality |
3 | E | Moderate quality |
2.5 | F | Poor quality |
2 | G | Poor quality |
1.5 | H | Very poor quality |
1 | I | Very poor quality |
Further Analysis:
Two Way Indicator Species Analysis (TWINSPAN):
A method of community analysis by grouping sites together solely on the species that are identified. TWINSPAN is a multivariate classification technique that groups similar sites together by successive dichotomous divisions, leading to increasingly similar groupings of sites at each division. TWINSPAN also indicates which species, if any, on each side of the dichotomy are characteristic' of the division. The final end groups' produced by this technique contains sites which show the greatest similarity, which may then be described in terms of water quality characteristics. It is important to remember that TWINSPAN works on all taxa available (e.g. Rhyacophilidae and Glossosomatidae where they occur together) and on macroinvertebrate associations rather than attributing scores to each family.
References:
Langley, J., Kett, S. (1997). PSd Stream Monitoring Training - Course Notes Langley, J., et.al. (1999). An assessment of biological water quality of Jersey freshwater streams 1997/1998: the effects of seasonal variation. A report to the States of Jersey PSd.