The official version of this document can be found via the PDF button.
The below content has been automatically generated from the original PDF and some formatting may have been lost, therefore it should not be relied upon to extract citations or propose amendments.
Planning, Environment & Design
![]() States of Jersey Transport and Technical Services
States of Jersey Transport and Technical Services
|
|
|
|
Baseline Water Quality Review November 2011 |
|
|
|
|
![]() Quality Management
Quality Management
Job No | CS/049696 | Doc No. | CS049696-07-01 Version 3 |
Project | La Collette Headland Stage 3 - Water Quality | ||
Location | La Collette Waste Management Facility, St. Helier , Jersey | ||
Document Ref | FINAL | ||
File reference | F:\ZENV\!Projects\CS049696 La Collette Headland Stage 3\B.Work_Tasks\03 WATER QUALITY\04_Reports\Baseline water quality report\La Collette_Baseline Water Quality report_v3_FINAL_281111.doc | ||
Date | 29 November 2011 | ||
Prepared by | Claire Howarth Principal Hydrogeologist | Signature (for file) |
|
Checked by | Dr. Rob Hares Associate Director Nick Ellis Principal Ecologist | Signature (for file) |
|
Authorised by | Gemma Niven-Reed Senior Environmental Consultant David Mason Associate Director | Signature (for file) |
|


![]() Contents Executive Summary i
Contents Executive Summary i
- Introduction 1
- Background 1
- Scope of Report 2
- Limitations 2
- Disclaimer 2
- Hydrogeological Conceptual Model 3
- Introduction 3
- Sources 3 Municipal Solid Waste Incinerator Ash Residue 6
- Pathways 8
- Receptors 19
- Baseline Data Collection 25
- Introduction 25
- Water Quality Determinands 25
- Sampling Methodology 26
- Results 30
- Introduction 30
- In-Situ Water Quality 30
- Heavy Metals 33
- Nutrients 38
- Phenols 43
- Total Petroleum Hydrocarbons 43
- Polyaromatic Hydrocarbons (PAHs) 43
- Summary 47
- General 47
- Receptor Baseline Water Quality 49
- Pathway Baseline Water Quality 49
- Ash Cell Baseline Water Quality 50
- Conclusions 51
- References 52
Figures
Figure 1 Location plan.
Figure 2 La Collette Headland overview.
Figure 3 Below water fill material.
Figure 4 Discharge consents and soakaways.
Figure 5 Fuel storage and transport.
Figure 6 Groundwater level ranges & lag times (spring & neap
tides).
Figure 7 Spring tide groundwater levels (m ACD) - Feb & June
2011.
Figure 8 Baseline monitoring locations.
Figure 9 Salinity - in-situ readings (average).
Figure 10 Electrical Conductivity (µS/cm) - in-situ readings
(average).
Figure 11 pH & Redox - in-situ readings (average). Figure 12 Zn & Cu concentrations (average). Figure 13 Fe concentrations (average).
![]() Figure 14 Ammonium & Nitrate concentrations (average). Figure 15 Total TPH (µg/l) concentrations (average).
Figure 14 Ammonium & Nitrate concentrations (average). Figure 15 Total TPH (µg/l) concentrations (average).
Figure 16 PAH - Anthracene & Benzo(a)pyrene concentrations
(average).
Figure 17
Plates Plate 2.1 Plate 2.2
Tables Table 2.1
Table 2.2
Table 2.3 Table 2.4 Table 2.5 Table 2.6 Table 2.7 Table 2.8
Table 2.9 Table 2.10 Table 2.11 Table 3.1
Table 3.2 Table 4.1 Table 4.2 Table 4.3
Table 4.4 Table 4.5
PAH sum (µg/l) concentrations (average).
Initial Source – Pathway – Receptor Model. 8 Variation in hydraulic gradient during the tidal cycle
(schematic) 16
Key potential contaminant sources within the wider
La Collette development area that may influence baseline water quality. 4
Key potential contaminant sources within the La Collette Waste Management Facility area that may influence baseline water quality. 5
Summary of leachate analysis results (WRC 2003
and 2007) 6 Summary of actual versus predicted leachate
extraction volumes (maximum run-off) 10 Actual versus predicted extraction volume
differences compared to total cell volume. 10 Summary of groundwater level monitoring results
(2010 – 2011). 12 Estimated duration of groundwater exit and entry
into WMF. 16
Phase 1 versus Phase 2 groundwater level
monitoring (13 Feb – 16 March 2011) 17 Potential receptors. 19 Sensitivity rankings for specific ecological receptors 21 La Collette water quality standards. 23
In-situ water quality parameters during 20 minute purging. 27
Water quality results for BH3d (4 – 5 April 2011) 28 pH and redox statistics for southern ash cells 32 Average dissolved heavy metal concentrations 34
Number of monitoring points where average heavy metal concentrations exceeded EQS 35
Average nutrient concentrations. 39
Anthracene and Benzo(a)pyrene concentrations in groundwater. 44
![]() Appendices
Appendices
Appendix A Figures
Appendix B Potential Contaminant Sources Associated with
La Collette Headland
Appendix C In Situ Water Quality Results
Appendix D Laboratory Analytical Results
Appendix E Extracted Data & Statistics
Appendix F Groundwater Level Hydrographs Appendix G Ecological Water Quality Literature Review
Executive Summary
This report presents a review of the monitoring results from a six month baseline water quality monitoring survey of the La Collette Waste Management Facility (WMF), in conjunction with knowledge gained from parallel studies and groundwater level monitoring to provide an updated hydrogeological conceptual model. This document is a stand-alone report that will be used to inform any future operational water quality monitoring strategy or impact assessments for future development proposals.
The La Collette Waste Management Facility (WMF) currently operates under a deemed waste management licence. Since 1995 the WMF has received a mixed waste stream with inert materials deposited behind the rock armour wall below the mean High Water Spring Tide level (11 m above ACD[1]), and incinerator ash residue (predominantly bottom ash) placed in 4 – 5 m deep lined cells above the spring line. Ancillary activities at the site include green composting, aggregate recycling and the temporary storage of bio-remediated soils and street sweepings on top of lined cells. Historic and other current activities beyond the site that may influence water quality within the wider water environment (including the Ramsar designated area to the south and east of the WMF) include: a remediated diesel spill in the northern corner of the southern working area of the site; historic temporary bulky waste storage within unlined pits; and discharges from the Energy from Waste / JEC Plant outfall.
To gather scientific evidence on baseline water quality, and to ascertain if there are any significant impacts of WMF operations on water quality within the within the wider water environment, monthly sampling at 42 locations (18 ash cells, 7 boreholes, 5 springs issuing from inert waste material underlying the ash cells, and 12 low tide seawater locations within the Ramsar area beyond the sea wall) were undertaken between March and August 2011. Laboratory analysis for each sample for up to 75 chemicals (including heavy metals, nutrients, and organic hydrocarbons), chosen as representative of potential contaminants that may by associated with historic or current activities at the WMF and surrounding area. This is considered to represent an effective spring / summer dataset, sufficient to rationalise future monitoring requirements and to form a baseline for comparison to inform any subsequent impact assessments.
Water quality standards are used as guidelines to assess water quality, but this benchmark is not regarded as critical to the water quality required to protect sensitive receptors, rather as an indication where raised levels exist as a result of background, legacy or possibly current operations.
No biological water quality or biota sampling was undertaken as part of this baseline monitoring survey as this would form part of wider environmental monitoring and would not be a direct assessment of the sites contribution to water quality.
GROUNDWATER MOVEMENTS
With respect to the WMF, groundwater ingress to and egress from the site during the tidal cycle is both via the Phase 2 rock armour wall / inert waste, and via natural channels filled with beach deposit material within the underyling diorite / granodiorite bedrock. Tidal variation within groundwater levels, combined with the lag time between peak tidal levels and peak groundwater levels, suggest a difference in groundwater behaviour in the west of the site to that in the east of the site.
In the west little tidal variation (0.25 m) is observed with lag times up to 6 hours, suggesting limited interaction between the sea and groundwater, plus groundwater levels are lower than those to the east suggesting a groundwater low area. In contrast, in the east groundwater movements appear more dynamic with greater tidal variation (1 – 3 m) and shorter lag times (1½ - 3 hours) suggesting a greater degree of interaction between the sea and groundwater in this area.
Basal elevations of lined ash cells is approximately 1 m (or more) above the highest groundwater level recorded. A basic water balance assessment of leachate volumes within the ash cells suggests hydraulic containment (over three levels of cells) is performing within climatic expectations, suggesting that liners are performing to engineering expectations without a loss of leachate to underlying inert waste / groundwater. Comparison of groundwater quality to ash cell quality further supports this.
RECEPTOR WATER QUALITY
Groundwater within the inert waste of the WMF does not have an amenity or water supply use. As such it is not considered to be a key receptor, with monitoring focused on its ability to act as a pathway for chemicals to the wider water environment.
The key receptor of interest is the coastal waters of the adjacent South East Coast of Jersey Ramsar. A brief literature review indicates that generally key Ramsar species are broadly tolerant to significant changes in water quality, with the exception of:
- Common Eelgrass – sensitive to nutrient changes, principally nitrates and phosphates.
- Maerl & Sweet Cup Coral – sensitive to changes in sediment concentrations.
- Native Oyster – sensitive to changes in some heavy metals during the larval stage (principally mercury, copper, cadmium and zinc), although the adult population are generally tolerant of high levels of copper and zinc.
The evidence from publically available information would suggest that large populations of the above species are not found adjacent to the La Collette headland. However they will still remain a consideration within any future impact assessments.
Currently accepted water quality standards tend to be more conservative / onerous than the limited published research on tolerable water quality concentrations for key indigenous species would suggest. As such the standards have been used for guidance only, with comparison made to a local natural baseline sea water monitoring point for context. Being located at the furthest distance from waste activities and other activities associated with the La Collette Headland, SW1 was considered to represent a local natural baseline monitoring point to compare to.
Beyond the rock armour wall average concentrations of organic hydrocarbons (phenols, BTEX[1], and Polyaromatic Hydrocarbons), nitrates, phosphates and the majority of heavy metals did not exceed water quality standards. Average copper concentrations marginally exceeded the water quality standard at two isolated seawater monitoring points (of the 12 locations sampled), although the reason for this marginal local effect is unknown it is not regarded as a matter for concern for the sensitive receptors.
Widespread receptor exceedence of water quality standards in respect of iron and ammonium is noted, including at SW1. This may be potentially influenced by the natural granodiorite geology (in the case of iron) or a wider water environment impact from surrounding anthropogenic activities (in the case of ammonium), in combination with a small diffuse contribution from the WMF. However this cannot be confirmed, or the precise contribution from the WMF to the wider water environment, in the absence of wider water environment monitoring (which is beyond the remit of Transport and Technical Services).
PATHWAY WATER QUALITY
Springs issuing from the inert waste, representing a more generic water quality from the inert waste body, within the site reflect a similar water quality to that of seawater beyond the sea wall (i.e. the majority of contaminants are present at concentrations below water quality standards).
Groundwater quality further inland within the WMF site (recorded in boreholes sampling a restricted local sampling area) generally reflects a baseline chemical water quality signature associated with historic activities and inert waste disposal, although water quality within the waste springs and seawater beyond does not suggest that such historic influences are having a significant impact on Ramsar water quality.
The near neutral – slightly alkaline pH environment, combined with generally reducing conditions (only marginally oxidising once water reaches the open sea beyond the sea wall) are not conducive to significant degradation chemical reactions. As such, reduction in contaminant concentrations observed between groundwater and the sea is predominantly due to dilution associated with the twice daily flushing of sea water through the site. Within open sea, a short distance beyond the sea wall, conditions would be expected to become oxidising promoting oxidation and further reduction in recorded concentrations.
ASH CELL WATER QUALITY
Overall ash cell leachate concentrations were observed to be at the low end of the range of concentrations reported within WRCs 2003 / 2007 leaching studies. Heavy metal concentrations were found to be similar in scale to that which may be associated with an urban run-off.
Water quality in individual cells is highly variable, with no obvious trends (from the review of monitoring data collected to date) associated with the age of the ash. Variation in leachate composition may be more reflective of variations in the composition of the waste initially burnt masking any obvious trends in ash degradation over time.
Widespread exceedence of water quality standards for arsenic, copper and nickel was noted, with only occasional cells recording exceedences for chromium, manganese and iron. Ammonium concentrations varied over several orders of magnitudes. Anthracene and benzo(a)pyrene levels marginally exceeded the water quality standard, however concentrations of other organic contaminants (phenol, naphthalene and BTEX) were generally below water quality standards.
CONCLUSIONS
The six month baseline water quality monitoring survey, plus groundwater level monitoring, has considerably improved our understanding of the hydrogeological and water quality regime of the La Collette WMF (and immediate surrounding area).
Water quality in the sea surrounding the site was found to be generally of a quality that would not be of concern for the sensitive receptors that in the area. The evidence examined would suggest that the ash cells are effective in containment of the low level contaminants in the cell water.
Inert waste protocols implemented by TTS at the WMF over the past 15+ years, together with implementation of appropriate mitigation measures (e.g. lining and capping of ash cells), have reduced the risk of a significant introduction of contaminants into underlying groundwater. In combination with the dilution effect of a site that is flushed through twice daily, concentrations recorded in sea water are within acceptable limits.
It is acknowledged that this current monitoring dataset represents a spring / summer baseline, and as such will be supplemented with additional data during operational monitoring (proposed to be undertaken quarterly and focused on key monitoring locations / determinands). In combination with any wider water environment monitoring undertaken by parties other than TTS, such information will, in the future, enable further improvements to the understanding of La Collettes contribution to the water quality the wider water environment (including the Ramsar designated area to the south and east of the WMF).
- [1]Introduction
- BACKGROUND
- The La Collette Waste Management Facility (hereafter referred to as the WMF, the boundary of which is shown in Figure 1) currently operates under a deemed waste management licence. Since 1995 theWMF has received a mixed waste stream3 with inert materials deposited behind the sea wall up to a level between the Mean High Water Spring (MHWS) level (approximately 10.96 m ACD[2]) and the top of the sea wall (14 – 15 m ACD), and ash placed in lined cells above the spring line.
- Since 2003 an aggregate recycling facility has been incorporated into the inert process, removing suitable granular material as secondary aggregate product for construction re-use and some metals inclusions for scrap recovery from the waste stream prior to disposal. Other activities on-site include green waste composting, the temporary processing of bio- remediated soils and storage of street sweepings on top of lined cells.
- Although not obliged to have a water quality monitoring strategy in place under current permissions and licences, given the proximity of the WMF to the internationally designated South East Jersey Coast Ramsar area, the States of Jersey Environment Protection Department wanted to see a robust strategy for water quality monitoring brought into place.
- To gather scientific evidence in support of planning / waste management licence applications at the WMF, and in support of the current deemed waste management licence, TTS commissioned Capita Symonds Ltd (Capita Symonds) in June 2010 to develop a baseline water quality monitoring strategyto ascertain if there is any significant impact of WMF operations on receptor water quality. The early results of such baseline monitoring could inform refining the monitoring programme and network, such that an appropriate water quality monitoring strategy to be implemented during site operations can be developed.
- Monthly baseline water quality monitoring was undertaken between March and August 2011. In addition other parallel pieces of work have been undertaken to inform our understanding of the hydrogeological system and water quality within the WMF and surrounding environment. Referred to throughout this document, they principally comprise:
- La Collette Water Quality Monitoring Strategy. Stage 1: Contextual Factual Report (Sept 2010).
- La Collette Waste Management Facility and Surrounding Area. Water Quality: Source Analysis Review (May 2011).
- La Collette Waste Management Facility. Ash Cells: Hydrogeological Conceptualisation (November 2011).
- SCOPE OF REPORT
- The purpose of this report is to review the monitoring results from the 6 month baseline water quality monitoring period, together with knowledge gained from parallel studies and groundwater level monitoring to present an updated hydrogeological conceptual model (to that last documented in Sept 2010).
- This document is a stand-alone report that will be used to inform any subsequent development of a water quality monitoring strategy during operation, Environmental Impact Assessment for future planning applications, or Hydrogeological Risk Assessment in support of Waste Management Licence applications.
- Section 2 presents an updated Source-Pathway-Receptor hydrogeological conceptual model, drawing upon the results of the aforementioned parallel studies. Section 3 factually reports the extent of the monitoring undertaken during the baseline period (in terms of approach, methodology, determinand suite and sample locations).
- Water quality monitoring results are summarised in Section 4 with full data sets presented in Appendices C – E. An over-arching summary is presented in Section 5.
- LIMITATIONS
- The purpose of the baseline period of monitoring has been to characterise existing water quality at the WMF and immediately beyond the sea wall, such that the data maybe used as baseline for judgement of future development proposals interms of hydrogeological risk assessments, and against which future monitoring data can be compared.
- As such the focus for the water quality monitoring is the WMF and its potential for ongoing diffuse discharge to the wider water environment (including the Ramsar designated area to the south and east of the WMF), rather than on establishing water quality of the wider marine environment. No biological water quality or biota sampling was undertaken as part of this baseline monitoring survey as this would form part of wider environmental monitoring and would not be a direct assessment of the sites contribution.
- Although the gathering of baseline monitoring data has helped to further develop our conceptual knowledge of the site, the baseline monitoring is not intended to fully explain the complexities of the hydraulic regime at the site nor reach definitive conclusions as to the influence of historic activities on the water quality regime.
- No numerical modelling of water levels, or calculation of groundwater / surface water mass fluxes has been undertaken as part of this work.
- DISCLAIMER
1.4.1 This report is for the use of States of Jersey Transport and Technical Services Department only and should not be relied upon by other parties unless advised by Capita Symonds Ltd in writing.
Conceptual Model
- Hydrogeological Conceptual Model
- INTRODUCTION
- An initial source-pathway-receptor (SPR) conceptual model was outlined in Capita Symonds
Stage 1 Report (Sept 2010). The aforementioned report highlighted several areas of conceptualisation where knowledge (at that time) was limited, including:
- An improved understanding of baseline influences of other potential sources in the wider water environment;
- Evidence for the integrity of the ash cells;
- An improved understanding of the nature of fill material below water within the La Collette WMF, and its influence on water quality;
- The degree of hydraulic connection across the site; and
- Water quality in the receptor (beyond the sea wall).
- To address these knowledge gaps, further work[1] (including some periods of groundwater level recording and 6 months of baseline water quality monitoring – see Section 3 for detail) has been undertaken.
- This section presents an updated hydrogeological conceptual model for the WMF and surrounding area, drawing upon previous work and additional information (excluding consideration of water quality results that are discussed in Section 4) gathered since the
aforementioned report was written.
- SOURCES
- Built out from the 1960s to the present day, the La Collette development area currently
encompasses a number of different zones (Figure 2):
- Pre-1965 reclamation (encompassing Jersey Electricity Corporation (JEC) power plant).
- 1970/1980s Phase 1 reclamation (encompassing the abattoir, current Esso / Rubis fuel consortium and various light industry).
- 1990s to date Phase 2 reclamation (encompassing the Connex bus depot, the Energy from Waste facility and activities (both past and present) at the La Collette Waste Management Facility itself).
- Key potential sources that may influence water quality within La Collette or the surrounding area are summarised in Tables 2.1 (wider area) and 2.2(WMF area), with expanded notes contained in Appendix B. Formore detail the reader is referred to the main Source Analysis Review report (May 2011). Further discussion of potential leachate associated with the ash source is outlined from paragraph 2.2.3 onwards.
Table 2.1: Key potential contaminant sources within the wider La Collette development area that may influence baseline water quality.
(derived from Capita Symonds Source Analysis Review, May 2011).
Potential Source | Location / Area | Potential to influence baseline water quality within or to the east of La Collette WMF |
Below water fill material (Figure 3) | JEC Power Plant area | Low to Negligible- Given that deposition was over 40 years ago, and there will have been a significant through-flow of water since that time, it is considered unlikely that the fill material is contributing significant concentrations of contaminants. |
Phase 1 | Low - The location of the Phase 1 rock armour wall, combined with the consolidated dredged sand, (conceptualised as a high permeability pathway for groundwater to flow west), would suggest that potentially the movement of groundwater between Phases 1 and 2 is likely to be minimal (see paragraph 2.3.30). | |
Phase 2 | Low - Moderate – given the ingress and egress of tidal waters through the fill, combined with acceptance procedures, the likelihood of significant influence is likely to be low. However the potential for rogue materials cannot be completely ruled out, and as such the potential to influence water quality is adjusted to Low – Moderate. | |
Above water fill material | Phase 1 | Low - The nature of the fill materials, combined with the presence of the high permeability rock armour wall acting as a preferentially pathway, means that material is unlikely to have a significant influence on quality within Phase 2. |
Phase 2 | Bus Depot / EfW plant - Low - Moderate - material at Bus Depot observed to be consolidated at time of site investigation. Fill materials would not be expected to generate significant concentrations of contaminants, however the potential for rogue materials cannot be completely ruled out, and as such the potential to influence water quality is adjusted to Low – Moderate. Former Aggregate Working Area – Moderate. Although cleaned up to agreed limits, the remaining TPH in soils above water will potentially have some residual diesel hydrocarbon signature on water quality. Ash Pits – Moderate – High. If engineering measures failed, potential leachate quality within the ash pits has a moderate to high risk of influencing baseline water quality within the WMF. Bulky Waste Pits – Moderate – High. Relatively unknown material deposited, in unlined pits that may have undergone some decomposition. Given the un-quantified nature of these pits, a moderate to high risk of influencing baseline water quality within the WMF has been assigned. See Section 4for further discussion. | |
Discharge Consents (Figure 4) | Phase 1 | Low -. Given the immediate dilution from mixing with sea water, combined with the harbour currents within St. Aubins Bay, it is unlikely the Phase 1 discharges will significantly influence water quality to east of WMF. |
Phase 2 | JEC waters - Low. Power plant is generally non-operational for the majority of time. EfW plant – Low to Moderate. Clean waters discharge, but potential for oil and silt if drainage interceptors fail. | |
Soakaways (Figure 4) | La Collette development area | Low - soakaways, receive run-off from areas of hardstanding or roads that may potentially contain low concentrations of contaminants (generally silt or hydrocarbons). In addition drainage passes through standard oil interceptors / silt traps reducing the potential for such pollutants to contribute to baseline water quality. |
Fuel Storage and Transport (Figure 5) | JEC Power Plant | Low. Any leakage would be likely to enter the power plants drainage system, with hard standing run-off passing via oil interceptor to the buried culvert to the south ultimately discharging to the Havre des Pas bay area. |
Phase 1 | Low – Although the potential exists for fuel leaks to enter the water environment, principally via the Phase 1 rock armour wall and the soakaway in the Connex bus depot, the presence of the high permeability rock armour wall would suggest minimal groundwater movement between Phases 1 and 2. As such the potential to influence water quality to the east of Phase 2 is considered to be low. |
Table 2.2: Key potential contaminant sources within the La Collette Waste Management Facility area that may influence baseline water quality
(derived from Capita Symonds Source Analysis Review, May 2011).
Potential Source | Location / Area | Potential to influence baseline water quality within or to the east of La Collette WMF |
Green Composting Operations | Green Composting Area | Low - Moderate. Processing areas are paved aprons, with re-circulated waters and reception area run-off disposed to foul sewer. Potential for infiltration if concreted areas become damaged significantly as such the potential to influence water quality is adjusted to Low – Moderate. |
Temporary Bulky Waste Storage | East Pit & two buried pits to west of Ash Pits 26 / 28 | Moderate – High. Given the unlined nature of the pits, the potential exists for such material to have a component of influence on baseline water quality within the underlying inert fill in the short |
Ash disposal | Ash Pits | Moderate – High. If engineering measures failed, potential leachate quality within the ash pits has a moderate to high risk of influencing baseline water quality within the WMF. |
Road Sweepings & Contaminated Soils Temporary Storage | Over various open lined ash pits | Moderate - Any leachate generated is captured within the ash cell leachate. Should ash cell engineering measures fail, then there is potential that this source may contribute to the influence of ash leachate upon the underlying water quality. |
Fuel Storage | Recycled Aggregate Production Area | Low - Moderate. Double skinned tanks provide some mitigation through capture of fuel if inner tank were to be ruptured, however any rupture of the second skin or accidental spillage may not be mitigated. |
Weighbridge Area / General Site | Low - Moderate. Double skinned tanks provide some mitigation through capture of fuel if inner tank were to be ruptured, however any rupture of the second skin or accidental spillage may not be mitigated. | |
Wheelwash waters and run-off from Weighbridge area | Weighbridge | Low -. Few sources of concern, combined with concreted areas and re-circulated waters minimises risk of influence to baseline water quality below WMF. |
MUNICIPAL SOLID WASTE INCINERATOR ASH RESIDUE
- Of the 5-8% of fill received previously from the Bellozane municipal solid waste incinerator (MSWI) residues / ash received at the WMF, it is estimated 21% comprises bottom ash, 4% fly ash and 1% metal inclusions. In the absence of detailed information on waste materials by cell, it is conservatively assumed that all cells historically received a mixture of bottom ash, fly ash, scrap inclusions material, with some occasional putrescible material and small quantities of contaminated soils historically.
- The La Collette Energy fromWaste(EfW) facility has a new process producing grate ash with ferrous metal separation and flue gas treatment residues. The plant which came on- line in 2011, will be fully operational in 2012. As such the receipt of wastes from Bellozane ceased in 2010 and has been replaced with intake of MSWI residues from La Collette (EfW). It is estimated that for each tonne of MSW burned within the new facility 25% will become bottom ash residue, 2% non-hazardous ferrous metals, and 4% Air Pollution Control (APC) residue (Capita Symonds EfW Residue High Level Review, Sept 2010). For the purpose of review of baseline water quality monitoring data however, the main area of focus is on potential leachate concentrations associated with previous ash from the Bellozane incinerator. This did not include APC residue since there were no such control measures in place at the historic plant.
- Capita Symonds Stage 1: Contextual Factual Report (Sept 2010) provides a review of desk study information available on the potential composition of leachate from Incinerator Bottom Ash (IBA) and Fly Ash. Key points are summarised below for context to this report.
Bottom Ash
- Bottom ash particles range in size from a fine gravel to a fine sand with verylow percentages of silt-clay sized particles. WRCs 2003 and 2007 ash characterisation studies examined the leaching potential of ash products generated by the Bellozane MSWI (receiving a mixture of municipal solid waste, shredded domestic and wood waste plus electrical goods). Table 2.3 summarises the range of inorganic and organic results from the two studies.
Table 2.3: Summary of Leachate Analysis results (WRC 2003 and 2007)
Determinand | Concentration | Determinand | Concentration | Determinand | Concentration |
| Range |
| Range |
| Range |
|
|
|
| ||
|
|
|
| ||
|
| Dioxins & Furans | 0.002 - 50 | ||
|
|
|
| ||
|
|
|
| ||
|
| Mineral oils (total, | 56 -228 | ||
|
|
|
| ||
|
|
|
| ||
|
| BTEX (total, ug/l) | <0.01 – 0.42 | ||
- It is noted that the above studies did not report on potential iron concentrations within leachate samples derived from the Bellozane bottom ash in 2003 and 2007. Values quoted from a german paper (Pfrang-Stotz & Reichelt, 2000) show a range in iron concentration of 48 – 75 ug/l.
- With respect to potential non-metal concentrations within the IBA leachate, the Environment Agency[1] note a range of concentrations for Ammoniacal Nitrogen (100 – 1,000 mg/l), Chloride (1,000 – 10,000 mg/l), and Sulphate (1,000 – 10,000 mg/l). They also note that a lysimeter study undertaken within IBA yielded Chloride concentrations of approximately 10,000 mg/l and Sulphate concentration of 550 mg/l.
- It can be seen that leachate composition may potentially be quite varied, and tends to fail environmental water quality standards, as such disposal to lined pits is considered appropriate.
Fly Ash
- Background research indicates that only 2% of fly ash component is soluble, with leachate tending to be characterised by a non-reducing and alkaline environment. Arsenic (As) is usually present in its anionic form, with solubility tending to be suppressed by the presence of calcium. However pH may decrease over time as calcium oxide is used up, leading to an increased risk of heavy metal dissolution. Surface iron oxide coatings, combined with alkaline pH, have a dominant influence on the sorption of trace heavy metals. In the case of the Bellozane ash, results from the WRC characterisation studies would suggest initial leachate pHs of 10.5 – 12.5.
- Fly ash exceedences in general tend to be with respect to: calcium (Ca); magnesium (Mg); sodium (Na); potassium (K); sulphate (SO4); chloride (Cl); fluoride (F); nitrate (NO3), selenium (Se); and boron (B). Exceedences tend to reach peak highs rather than sustained concentrations over a greater period of time. B tends to become quickly sorped to clays and iron oxides. Dioxins and furans are predominantly concentrated in the fly ash (0.2-10 ng/kg compared to 0.001-0.01 ng/kg in the bottom ash of the Bellozane waste residue, WRC 2007 report).
- With respect to Ammonia in fly ash leachate, Total Kjeldahl Nitrogen[2] concentrations are noted in Environment Agency research (Robinson et al, Sept 2004) tobe approximately 25 mg/l. Only trace concentrations of PAHs and BTEX were noted, with oil concentrations less than 1 mg/l.
- PATHWAYS
- As highlighted in Capita Symonds Stage 1 Report (Sept 2010), there are several potential hydrogeological pathways (both natural and anthropogenic in nature) via which contamination from sources identified in Section 2.2 may reach the surrounding surface water environment to the south and east of La Collette to a greater or lesser degree. Illustrated in Plate 2.1 below, these include:
- If liner integrity were compromised leakage from the ash cells to underlying inert waste material;
- Infiltration of rainfall, and run-off from site activities, to ground (inert waste);
- Groundwater flow via tidal ingress in and out of inert waste to adjoining lagoons within the WMF or discharging as springs / streams through rock armour walls (Phases 1 and 2); and
- Sea water movement directly through rock armour wall to Western and Eastern Lagoons within WMF.
Plate 2.1: Initial Source – Pathway – Receptor Model (taken from Capita Symonds Stage 1: Contextual
Factual Report, Sept 2010).
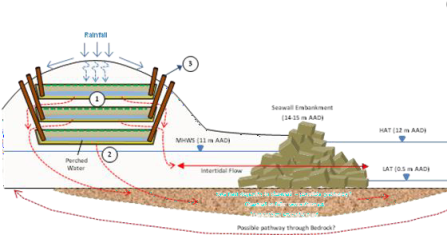
 Rainfall
Seawall Embankment (14 – 15 m ACD)
Mean High Water High Admiralty Tide (12 m ACD) Spring (11 m ACD)
Perched Water Intertidal Flow Low Admiralty Tide (0.5 m ACD)
Sea bed deposits in channel – possible pathway?
Possible pathway through bedrock?
ASH CELL LINER LEAKAGE POTENTIAL
- The ash cells at the site have been (and continue to be) constructed above the Mean High Water Spring line level of approximately 11m ACD, and are designed to operate on a hydraulic containment basis, whereby leachate in the ash waste is prevented from percolating into the ground beneath by a low permeability liner. Disposal commenced in the northern most part of the WMF from 1995, gradually moving south and south west over time.
- Ash cells are 4 -5 m deep, lined, with basal drainage layers for leachate collection and a rainshed capping installed after cell filling has been completed. Access pipes are located in cell corners to facilitate pumping out of infiltration leachate when evaporation is exceeded by rainfall rates in uncapped cells before final capping. 2 - 3 layers of ash cells arranged on top of each other have been created over time.
- The infiltration of rainfall into the cells (and hence leachate generation) after closure is also designed to be minimised either by the emplacement of a low permeability cap, or succeeded with further cells with caps at a higher level. In total there are up to three levels of ash pits (low, medium and high) within the WMF. Monitored for leachate levels, the pits have maintained veryminimal or no accumulation of water in the completed pits and only occasional extraction pumping has been required.
- In 2010/11 there has been an increasing demand for areas on the site to manage potentially contaminated or lightly contaminated waste material to allow bioremediation to occur, or to ensure this material does not go in to the general fill. Areas above the ash pits have been used as they provide a lined capture point for any potential contaminants.
- This activity has required a number of cells to be left uncapped for longer periods, providing a pathway for rainwater to infiltrate and generate leachate. To maintain a leachate level that does not over-top the pit walls, leachate is routinely abstracted from a number of ash cells (via the access pipes / dip tubes) and removed from site by tanker to the Bellozane Sewerage Treatment Works.
- To improve our understanding of the degree of ash cell liner integrity, and hence the potential for leakage of leachate to underlying inert waste material, Capita Symonds undertook a broad review[1]of the ash cells (in terms of leachate volumes, levels and quality). This included comparison of physical levels and estimated volumes of leachate to tanker records, to broadly ascertain whether leachate volumes were as expected within the cells (given the information available on their design, site conditions and local weather patterns).
- Working upon the assumption that leachate is pumped to maintain a head level (i.e. there is no change in storage), and that there is no ingress from groundwater (given that the pits lie above groundwater) the volume of "water in" to the system should be equal to the volume of "water out" if there is no leakage from the cell. A basic, simple water balance spreadsheet assessment was undertaken for existing ash cells from which leachate was extracted in 2010/11 to predict theoretical abstraction volumes required to maintain a steady leachate head (i.e. to prevent the depth of leachate increasing), if the assumed climatic catchment and cells hydraulic containment were functioning as expected. The spreadsheet model was run for each pumped cell for an autumn-winter scenario and a winter-spring scenario (with zero or maximum run-off taken into account).
- Whilst the spreadsheet model was not calibrated with site-specific evaporative / interception data, these theoretical leachate extraction volumes were compared to records of actual leachate extraction to ascertain whether the ash cells, broadly speaking, had predicted leachate volumes within them. If the volume actually abstracted was less than predicted, this may potentially indicate some undetermined contribution or loss to the cells, or storage of leachate in perched water bodies not accessible to the dip tubes. Alternatively if the extracted volume was found to be greater than predicted this may potentially indicate an input derived from more than just rainfall.
- The results of the assessment (assuming maximum runoff) are summarised Table 2.4. It is important to note that the calculations are designed to provide a broad rather than precise prediction of the hydraulic behaviour of individual cells. The spreadsheet model was designed to give an indication of what might be expected in order that the general hydrometric behaviour of the ash cell system could be understood.
Table 2.4: Summary of actual versus predicted leachate extraction volumes (maximum run-off)
Ash Cell No | Level | Capped? | Autumn – Winter Scenario | Winter – Spring Scenario | ||
Actual (m3) | Predicted (m3) | Actual (m3) | Predicted (m3) | |||
16 | Low | Capped? | 159 | 121 (+38) | 115 | 140 (-25) |
17 | Low | Capped? | 32 | 39 (-7) | 31 | 45 (-14) |
22 | Low | Cell 26 above | 60 | 39 (+21) | Not pumped during this period | |
24 | Mid | Uncapped | 218 | 122 (+96) | 155 | 140 (+15) |
25 | Low | Cell 28 above | 386 | 135 (+251) | 218 | 156 (+62) |
26 | Mid | 80% covered | 10 | 107 (-97) | 68 | 123 (-55) |
27 | Low | Cell 31 (80%) | Not pumped during this period | 5 | 81 (-76) | |
28 | Mid | Uncapped | 86 | 120 (-33) | Not pumped during this period | |
29 | Low | Partially | Not pumped during this period | 47 | 150 (-103) | |
31 | Mid | Uncapped | Not pumped during this period | 57 | 126 (-69) | |
32 | Low | Uncapped | 11 | 84 (-73) | 107 | 140 (-33) |
( ) Difference between actual volume pumped and predicted extraction volume
+ = more water pumped than predicted to maintain steady leachate head (therefore head may change)
- = less water pumped than predicted to maintain steady leachate head (therefore head may change)
- To put some context to the difference in actual versus predicted extraction volumes, the difference in volume is compared to the total cell volume in Table 2.5 below:
Table 2.5: Actual versus predicted extraction volume differences compared to total cell volume
Ash Cell No | Cell Volume (m3) | Autumn – Winter Variation | Winter – Spring Variation | ||
Volume (m3) | (% of cell volume) | Volume (m3) | (% of cell volume) | ||
16 | 12,000 | +38 | 0.3% | -25 | 0.2% |
17 | 3,800 | -7 | 0.2% | -14 | 0.4% |
22 | 3,800 | +21 | 0.6% | Not pumped during this period | |
24 | 8,150 | +96 | 1.2% | +15 | 0.2% |
25 | 12,900 | +251 | 1.9% | +62 | 0.5% |
26 | 11,375 | -97 | 0.9% | -55 | 0.5% |
27 | 8,000 | Not pumped during this period | -76 | 1.0% | |
28 | 12,500 | -33 | 0.3% | Not pumped during this period | |
29 | 12,000 | Not pumped during this period | -103 | 0.8% | |
31 | 10,500 | Not pumped during this period | -69 | 0.6% | |
32 | 9,250 | -73 | 0.8% | -33 | 0.3% |
- Assessment results would suggest that the difference between actual and predicted extraction volumes is very small in the context of an individual cell volume (maximum of 1.9%). These percentage differences may reflect the accuracy of the spreadsheet model, and / or that pumping does not maintain a constant leachate level. Capita Symonds broad review would suggest that overall the hydraulic containment system is performing generally within climatic expectations, and there is no detailed evidence to indicate a significant loss of water from the cells that might indicate leakage to inert material below.
GROUNDWATER FLOW
- Previous review of groundwater level information (Capita Symonds Stage 1 Report, Sept 2010) suggested that the WMF groundwater levels and the extent of tidal influence vary on a localised scale. In the 2005 and 2007 investigations of the proposed Energy fromWaste facility, boreholes within 100 m of each other displayed very different groundwater levels (some being dry, whilst nearby a head of water being noted). In addition some were shown to be tidally influenced whilst neighbouring boreholes showed no such influence.
- During 2010 and 2011, further continuous monitoring of groundwater levels for short periods of time has been undertaken to:
- Inform the design of Asbestos Cell 30 (monitoring Boreholes 1 and 2, 3rd – 16th Aug 2010);
- Inform the design of Ash Cell 33 (monitoring Boreholes 3 and 4, 12th – 26th Nov 2010);
- To investigate the potential for hydraulic connection across the Phase 1 sea wall (monitoring WMF boreholes 1, 3 and 4 together with Rubis boreholes 3 and 6, 11th Feb – 3rd March 2011); and to
- Inform the design of Cell 34 (monitoring Boreholes 3, 5 and 7, 1st – 22nd June 2011).
- Results are summarised in Table 2.6 below (with hydrographs reproduced in Appendix F). These are discussed in the context of enhancing our hydrogeological understanding of flow through the natural (diorite / granodiorite, plus erosion channel fill below the waste deposits) versus anthropogenic (waste) deposits from paragraph 2.3.16 onwards.
Table 2.6: Summary of Groundwater level monitoring results (2010 – 2011)
|
|
|
| Neap Tide (low tidal variation) | Spring Tide (high tidal variation) | ||||
|
|
|
|
|
| ||||
St. Helier Sea Level (OS Grid Ref: 13/11 6466 4763) | n/a | n/a | 3-16 Aug 2010 | 4.43 low tide 7.70 high tide | 3.27 | n/a | 0.43 low tide 11.86 high tide | 11.43 | n/a |
12-26 Nov 2010 | 4.05 low tide 8.56 high tide | 4.51 | n/a | 1.91 low tide 10.72 high tide | 8.81 | n/a | |||
11 Feb – 3 Mar 2011 | 4.09 low tide 7.65 high tide | 3.56 | n/a | 0.34 low tide 12.03 high tide | 11.69 | n/a | |||
1 – 22 June 2011 | 3.23 low tide 8.92 high tide | 5.69 | n/a | 1.49 low tide 11.1 high tide | 9.61 | n/a | |||
BH1 | 150 m to lagoon | 50mm well, 12m screen. 12.35m Waste over Granite | 3-16 Aug 2010 | 7.92 low tide 7.99 high tide | 0.07 | ~4½ hours | 7.76 low tide 8.01 high tide | 0.25 | ~2 hours |
11 Feb – 3 Mar 2011 | 7.82 low tide 7.91 high tide | 0.09 | ~2 hours | 7.76 low tide 7.91 high tide | 0.15 | ~2½ hours | |||
BH2 (shallow) | 60 – 100 m | 20mm piezo, tip @ 6.1m bgl. Waste | 3-16 Aug 2010 | <7.89 (level dropped below logger) | Not possible to determine | ~5 – 6 hours | <7.89 low tide 9.55 high tide | > 1.66 | 5 – 6 hours |
BH2 (deep) | 60 – 100 m | 20mm piezo, tip @ 13.6m bgl. Channel fill / granite | 3-16 Aug 2010 | 6.36 low tide 7.65 high tide | 1.29 | 1½ - 2 hours | 6.33 low tide 9.95 high tide | 3.62 | 1½ - 2 hours |
BH3 (shallow) | 100 m to lagoon | 20mm piezo @9.5m bgl (filter pack 1.2-9.5m bgl). Waste | 12-26 Nov 2010 | 8.13 low tide 8.43 high tide | 0.30 | No lag, groundwater drains | 7.97 low tide 9.03 high tide | 1.06 | ~4 hours |
11 Feb – 3 Mar 2011 | 8.27 (min) 8.44 (max) | 0.17 | No lag or tides, groundwater drains | 8.20 low tide 9.76 high tide | 1.56 | ~ 1 hour | |||
1 – 22 June 2011 | 7.97 low tide 8.03 high tide | 0.06 | ~3 hours | 8.09 low tide 9.25 high tide | 1.16 | ~2 hours | |||

|
|
|
| Neap Tide (low tidal variation) | Spring Tide (high tidal variation) | ||||
Min & Max Levels (m ACD) |
| Lag between high tide & groundwater peak |
|
| Lag between high tide & groundwater peak | ||||
BH3 (deep) | 100 m to lagoon | 20mm piezo, tip @12.85m bgl, (filter pack 10.5 – 13.92m bgl), waste / natural. | 12-26 Nov 2010 | 7.80 low tide 8.41 high tide | 0.61 | ~3½ hours | 7.52 low tide 9.28 high tide | 1.76 | ~1½ hours |
11 Feb – 3 Mar 2011 | 7.76 low tide 8.26 high tide | 0.50 | ~3½ hours | 7.48 low tide 9.87 high tide | 2.39 | ~1 hour | |||
1 – 22 June 2011 | 5.72 low tide 8.15 high tide | 2.43 | ~1½ hours | 5.35 low tide 9.38 high tide | 4.03 | ~1½ hours | |||
BH4 | 175 m | 50mm well, screen 2 – 7.8m bgl (filter pack to 11.5m bgl), waste. | 12-26 Nov 2010 | 6.91 low tide 8.16 high tide | 1.25 | ~3 hours | 7.08 low tide 9.63 high tide | 2.55 | ~1½ hours |
11 Feb – 3 Mar 2011 | <7.65 (level dropped below logger) | Not possible to determine | Not possible to determine | 7.65 low tide 10.52 high tide | 2.87 | ~3 hours | |||
BH5 | 50 m | 50mm well, screen 5-7m bgl, waste | 1 – 22 June 2011 | 8.17 low tide 8.74 high tide | 0.57 | ~1 hour | 8.34 low tide 10.15 high tide | 1.81 | ~1½ hours |
BH7 (deep) | 200 m (lagoon), 125 m (Phase 1 wall) | 50mm, filter pack 1-8 mbgl, waste | 1 – 22 June 2011 | 7.60 low tide 7.62 high tide | 0.02 | not tidally influenced | 7.90 low tide 7.92 high tide | 0.02 | not tidally influenced |
Rubis BH3 | 100 m (Phase 1 wall) | 50mm, made ground | 11 Feb – 3 Mar 2011 | 6.07 low tide 6.52 high tide | 0.45 | ~6 hours | 6.44 low tide 7.68 high tide | 1.24 | ~5 hours |
Rubis BH6 | 10 m (Phase 1 wall) | 50mm, made ground / rock armour | 11 Feb – 3 Mar 2011 | 5.43 low tide 7.86 high tide | 2.43 | ~1 hour | 5.53 low tide 11.95 high tide | 6.42 | Coincident with high tide |
Pre-existing Natural Deposits
- As described in more detail Capita Symonds Stage 1 Report (Sept 2010), pre-existing natural deposits through which groundwater flowmay occur are likely to be confined to tidal erosion channels (filled with sand to clay material of 10-7m/s permeability) cut into the Diorite / Granodiorite bedrock (a strong deposit with pervasive tightly closed sub-vertical jointing and medium spaced orthogonal joint sets). With respect to the bedrock, matrix permeabilities would appear to be low (10-11 – 10-9 m/s), however several borehole records in historic site investigations note failure to achieve appreciable rise in head at start of test or loss of water during drilling suggesting the possible intersection with highly permeable fractures.
- With the building of the sea walls (Phases 1 and 2), and subsequent inert filling of the WMF, the possibility exists that some of these channel features may have become physically truncated blocking off their connection to the open sea. This may particularly be the case the further south and west across the site, however in the north eastern part of the WMF where bedrock elevations are higher, inert waste thicknesses may be such that the potential for movement through these natural channels remains a possibility.
- Although limited in duration and location, the monitoring of groundwater levels (or head) in piezometers located within underlying channel fill deposits (BH2d and BH3d) does record groundwater level rise and fall in response to tidal change indicating a hydraulic connection and potential pathway to the sea (Figure 6). In BH2d (located 60-100 m north of sea wall), up to a 3.62 m range in groundwater head was recorded (compared to an 11.43 m tidal range) with a lag time[1] of approximately 1.5 hours. In the case of BH3d (located 100 m west of the Eastern Lagoon) upto a 4.03 m range in groundwater head was recorded with a lag time of between 1 – 1.5 hours, similar in range and lag time to BH2d.
- With a groundwater head range approximately a quarter of the of the total tidal level range (up to 12 m during spring tide) within 100 m of the sea wall, there is a noticeable dampening effect on groundwater levels with distance inland from the sea wall. Lag times of 1 – 1.5 hours suggest some element of delay in response (reflective of the physical presence and permeability of channel deposits), but is still a relatively quick response to tidal change.
Anthropogenic Deposits
- Inert waste material, which tends to be a heterogeneous mixture ranging in grade from clayey siltysandy fine to coarse gravel to stiff slightly sandyclay, has been deposited up to an elevation between the Mean High Water Spring line (10.96 m ACD) and the top of the sea wall embankment (14 – 15m ACD). In between the lined pits such fill has also been deposited above water table to create edge cellbanks (prior to emplacement of liner). In respect to the vertical migration of rainfall, or any leachate following the theoretical failure of a cell liner system, these may potentially represent a pathway. However given the stacked and overlapping nature of the cells the possibility exists that these pathways may be truncated.
- A wide range of permeability[1] for made ground has been noted (10-7 – 10-5m/s) suggesting in some locations more granular material maybe emplaced that drains relatively well, whilst in other parts less permeable waste material maybein place. A review of groundwater level ranges and lag times in response to tidal changes (Figure 6) suggests a difference between groundwater behavior within the inert waste deposits in the western and eastern halves of the site.
- In the case of BH1, BH2s and BH7 (located in the western half of the site) groundwater levels recorded tended to show little to no variation attributable to tidal influence (with a maximum range of 0.25 m recorded in BH1 during spring tide). Maximum groundwater levels recorded did not exceed 8 m ACD (tending to be consistently lower than groundwater levels to the east), and lag times varied from 2 – 6 hours. This less dynamic groundwater environment may be indicative of a lower bulk permeability of inert waste in this area (a low permeability aquitard adjacent to BH7 has been noted[2]).
- In contrast recorded groundwater levels within the inert waste in the eastern half of the site show a consistent, more dynamic, pattern in terms of range (1 – 3 m variation) and tidal lag (approximately 1.5 – 3 hours) across the three shallow monitoring wells (BH3s, BH4, and BH5). The consistency in groundwater levels may suggest a morehomogeneous waste deposit than suggested during the initial hydrogeological conceptualization (Sept 2010). Maximum groundwater levels recorded during high tide ranged from 9.76 m ACD – 10.52 m ACD, below the ash cell base elevation of 11 m ACD.
- Recorded groundwater levels within the inert waste of the eastern half of the site are observed to decrease (as tidal levels decline) at a slower rate than when they increase in response to tidal level rise (Appendix F). This reflects more of a slower drainage response to declining groundwater levels, potentially linked to the presence of clay / silt material restricting infiltration. Conversely the more rapid rise in groundwater levels during the rising tide could potentially suggest an input of groundwater under more pressure (e.g. at high tide or via the underlying natural channel material).
- In a regional context groundwater will flow towards the sea, following an average hydraulic gradient. However the dynamic groundwater system underlying the WMF is such that flow directions and hydraulic gradients (which will control the volume and rate of groundwater movements) will vary locally during the course of a tidal cycle (as illustrated in Plate 2.2).
Plate 2.2: Variation in hydraulic gradient during the tidal cycle (schematic)
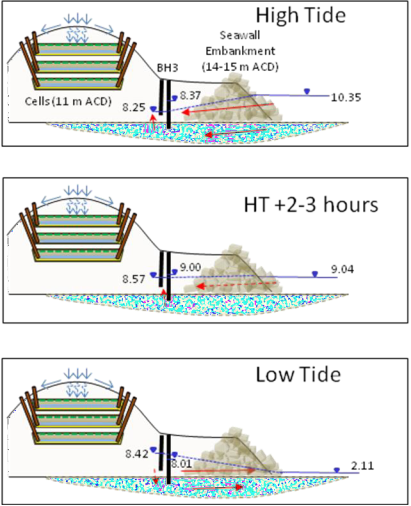
- Hydraulic gradients will vary from 0 (i.e. groundwater level and tidal level are equal) up to a maxima of approximately 0.02 (high tide) to 0.07 (low tide). Peak hydraulic gradients will, in reality, only be reached for a short period of time (tens of minutes) before they start to decline again as the tidal cycle reverses. For 6 – 9 hours of the tidal cycle, groundwater from the site is likely to exit the site, whereas for 3-5 hours ingress into the site is likely to occur. Table 2.7 summarises for each monitoring well approximate exit and entry times recorded.
Table 2.7: Estimated duration of groundwater exit from and entry into WMF
Monitoring Well | Exit Duration (groundwater level > tide level) | Entry Duration (groundwater level < tide level) |
BH1 | 6 hours | 3 hours |
BH3s | 8.5 hours | 4 hours |
BH3d | 8 hours | 4 hours |
BH4 | 6 hours | 5 hours |
BH5 | 9 hours | 3 hours |
BH7 | 8 hours | 5 hours |
Hydraulic Interaction Between Natural and Anthropogenic Deposits
- Monitoring wells BH2 and BH3 were converted to dual installations with piezometers located within the shallower inert waste and the deeper natural material. In both monitoring wells groundwater levels (head) within the deeper piezometers were higher than the maxima recorded within the shallower piezometers, and displayed a larger tidal variation in groundwater levels than recorded in the shallower deposits (Figures 6 and 7).
- In the case of BH3 at high tide, levels in deep piezometer were approximately 0.1 - 0.25 m higher than in the shallow piezometer indicating an upward hydraulic gradient pushing water from within the natural channel material up into the overlying waste. At periods of low tide the opposite occurred with levels in the deep piezometer about 0.4 - 0.7 m lower than those in the shallow piezometer, indicating a downward hydraulic gradient (suggesting water flowing in and out through the natural channels as well as through the waste).
- The difference in response times, together with the range of groundwater levels recorded, would suggest contrasting bulk permeabilities between the shallower fill and deeper channel sediment / granite system (with the inert fill material being slightly less permeable than the underlying deposits). Potentially, when considered in combination with the upward hydraulic gradient between the two systems, it may also indicate groundwater flow in / out via the channel infill and up into the overlying inert fill (in conjunction to movement directly into the fill through the sea wall).
Hydraulic Interaction Between Phases 1 and 2
- To investigate the potential for hydraulic interaction across the rock armour wall separating Phases 1 and 2 of the La Collette headland, dataloggers were installed in several locations across the two phases (including boreholes 3 and 6 within the Rubis fuel consortium area of Phase 1 and boreholes 1, 3 and 4 within Phase 2). Groundwater levels were recorded between 13 February and 16 March 2011, covering one monthly tidal cycle (as summarised in Table 2.8).
Table 2.8: Phase 1 versus Phase 2 groundwater level monitoring (13 Feb – 16 March 2011)
|
| Groundwater Level (m ACD) | Tidal amplitude range (m) | Groundwater peak lag behind high tide | |
Minimum | Maximum | ||||
Phase 1: Rubis Fuel Consortium | |||||
BH3 | 100 m | 6.02 | 7.66 | 0.3 – 0.6 | ~ 5 hours |
BH6 | 10 m | 5.48 | 11.95 | 2.5 – 6.5 | Coincident with high tide |
Phase 2: La Collette Waste Management Facility | |||||
BH1 | 150m (to lagoon) | 7.76 | 8.01 | 0.15 – 0.3 | ~ 2 hours |
BH3s | <100m (to lagoon) | 8.22 | 9.82 | ~ 1.7 | ~ 3 hours |
BH3d | <100m (to lagoon) | 7.39 | 9.88 | 0.3 – 2.5 | ~ 2 hours |
BH4 | 175 m | 7.64 | 10.52 | 3.0 | ~ 3 hours |
- With respect to Phase 1, groundwater levels and response times in BH6 (Rubis) indicates that groundwater in the response zone of this well is in hydraulic continuity with the sea, and that the connection is close and immediate. Given that the well is not adjacent to the sea, but is located close to the Phase 1 sea wall it is therefore considered that this near immediate response to tidal sea level change is as a result of flow within the former sea wall. It is considered likely that the former sea wall, having been constructed from open graded boulders, has a very high hydraulic conductivity, responding almost immediately to tidal variation in sea levels to the west of the La Collette headland.
- BH3 (Rubis) is located approximately 75 m west of BH6 (Rubis), neither adjacent to the sea or to the former sea wall. The groundwater response in this well to tidal sea level change is much slower (~ 5 hours), and has a much smaller amplitude than that at BH6 (Rubis), as may expected from the change being transmitted by groundwater flow in consolidated sand (lower permeability) beneath Phase 1 (Figure 6).
- In contrast, boreholes within Phase 2 showed a more uniform tidal lag of several hours (Figure 6) with daily tidal amplitudes of groundwater variation in wells BH1, BH3, and BH4 generally much smaller than that in BH6 (Rubis).
- Based on the evidence of rapid tidal water movement within the highly transmissive former sea wall between Phases 1 and 2, it is considered that any potential contaminated groundwater beneath Phase 1 flowing towards its eastern and southern boundaries would be diluted and flushed through the conduit formedby the former sea wall. This in combination with the presence of lower permeability consolidated sand acting as a partial hydraulic barrier, would suggest that the potential for any potential contaminants in groundwater within Phase 1 to be transmitted across the boundary into the ground beneath the WMF is low, as such the groundwater systems beneath these two portions of the La Collette headland could be considered separately.
SURFACE WATER
- In 1994/95 the Phase 2 sea wall, comprising largely rock armour and graded rock core material was built creating lagoon areas where bedrock is deeper than the surrounding area. As the inert filling proceeds, fabric material is overlain on the sea wall to aid the retention of fines within the site. Head differential across the wall is approximately 100 mm (0.1 m) suggesting hydraulic continuity between the sea beyond the wall and the lagoon areas.
- This is further supported by observations in some aerial photos of delta-like features deriving from occasional springs at the sea wall when approaching low tide. The boulder and granular fill nature of the sea wall would suggest moderate to high permeabilities, as such it is assumed that the sea wall does not act as a significant barrier to water flowinto and out of the Site.
- In terms of surface water within the sea wall, as well as lagoons, springs issuing from the inert waste material are noted at low tide with delta-like features observed on the lower slopes of the inert material. Water issuing from these springs runs into the Western and Eastern Lagoons, ultimately exiting the site via movement through the sea wall.
- RECEPTORS
- TheWater Pollution (Jersey) Law 2000 defines pollution as "..the introduction directly or indirectly into controlled waters of any substance, or energy, where its introduction results or is likely to result in –
- A hazard to human health or water supplies;
- Harm to any living resource or aquatic ecosystem;
- Damage to any amenity; or
- Interference with any legitimate use of controlled waters.
And whether or not its introduction is or would be the only contributing factor to that hazard, harm, damage or interference."
- Controlled waters are defined within the Water Pollution (Jersey) Law 2000 as:
- The territorial sea adjacent to Jersey.
- Coastal waters, being waters that are within the area that extends landward, from the baselines from which the breadth of the territorial sea is measured, as far as the limit of the highest tide.
- Inland waters, being the waters of lakes, marshlands, ponds, reservoirs, streams, surface water sewers, surface water drains and wetlands (whether in any such case they are natural or artificial, or above or below the ground), and not being coastal waters.
- Groundwater, being water that is below the surface of the ground, in the saturation zone and in direct contact with the ground or within the subsoil.
- Table 2.9 provides an overview of waters associated with the site and their potential to be classified as receptors (bearing in mind their usage and classification as controlled waters).
Table 2.9: Potential receptors (taken from Capita Symonds Stage 1: Contextual Factual Report, Sept
2010).
Water Use | Potential Receptor? | ||
| On-Site waters (within ash cells) | On-Site waters (groundwater) | Off-Site waters (open sea) |
Bathing waters | NO – perched waters not used for bathing. | NO – lagoons not used for bathing purposes. | YES – open sea waters are used for bathing. |
Water supply | NO – perched waters quality not suitable for water supply. | NO – salinity prevents use as water supply. | NO – salinity prevents use as water supply. |
Ecosystem support | NO – perched waters do not support any significant ecosystem. | NO – on-site groundwater does not directly support an ecosystem within the sea wall, but has the potential to provide a pathway should cell liners be breached. | YES – internationally designated coastal Ramsar. |
Oyster beds / farms | NO – no oyster beds are located on site. | YES – distant local oyster beds / farms supported by sea waters. | |
- During discussions between Capita Symonds, Golder Associates, TTS and the Environment Department on 2ndJuly2010 it was agreed that the key receptor is coastal waters, and as
such that water in the saturated zone beneath (or within) the landfill waste is not considered to be a key receptor (although it remains as a potential pathway).
- Subsequently Environmental Protection (Tim du Feu email, 22nd November 2010) confirmed:
The site has a saline water table which is unsuitable for abstraction. The adjoining open water sea (including pore water within the granite sea berm and infill) is controlled
waters. The La Collette lagoon is also technically a controlled water though it is appreciated that this will be filled and thereby removed as a controlled water, although the pore water within the infilled lagoon will still be classed as controlled water (meeting of 12th November 2010 between States of Jersey Transport and Technical Services department and States of Jersey Planning and Environment Department) from approx 2014 (the date will depend on the precise fill rate). The States of Jersey Planning and Environment Department (telephone conference on 2nd July 2010) have indicated that EU Coastal Waters standards are suitable standards to apply to controlled waters.
- A literature review of published information has been undertaken to improve our understanding of the sensitivity of the South East Coast of Jersey Ramsar site to changes in water quality (reported in Appendix F). The review focuses on significant ecological species of the Ramsar as general indicators of the sites overall sensitivity to key contaminants (as summarised in Table 2.10 overleaf).
Table 2.10: Sensitivity rankings for specific ecological receptors.
Ecological Receptor | Sensitivity to Environmental Change Factor | ||||
Sediment | Heavy Metals | Hydrocarbons | Nutrients | ||
Internatio | Zostera marina (Common eelgrass) | Moderate | Very Low | Very Low | Very High |
Zostera noltii (Dwarf eelgrass) | Low | Very Low | Moderate | Low | |
Laminaria digitata (Oarweed) | Low | Low | Low | Low | |
Hippocampus hippocampus (short snouted seahorse) | Very Low | Insufficient information | Insufficient information | Insufficient information | |
Pomatoschistus microps (Common goby) | Very Low | Moderate | Low | Insufficient information | |
Pomatoschistus minutus (Sand goby) | Not Sensitive | Moderate | Low | Not Sensitive | |
n Pholas dactylus (Common paddock) | Low | Low | Insufficient information | Insufficient information | |
Phymatolithon calcareum (Maerl) | Very High | Insufficient information | Insufficient information | Very Low | |
Ostrea edulis (Native oyster) | Very Low | High | Very Low | Not Sensitive* | |
National I | Ascophyllum nodosum (Knotted wrack) | Not Sensitive | Low | Low | Low |
Modiolus modiolus (Horse mussel) | Not Sensitive | Very Low | Very Low | Very Low | |
Gobius cobitis (Giant goby) | Low | Moderate | Low | Low | |
Pachycerianthus multiplicatus (Fireworks anemone) | Not Sensitive | Insufficient information | Insufficient information | Insufficient information | |
Eunicella verrucosa (Pink sea fan) | Very Low | Insufficient information | Insufficient information | Not Sensitive | |
Palinurus elephas mpo(European spiny lobster) | Not Sensitive | Insufficient information | Insufficient information | Insufficient information | |
Atrina fragilis (Fan mussel) | Very Low | Moderate | Insufficient information | Moderate | |
Leptopsammia pruvoti (Sweet cup coral) | High | Insufficient information | Insufficient information | Very Low | |
Not Listed | Urticina feline (Dahlia anemone) | Very low | Insufficient information | Very low | Insufficient information |
Metridium senile (Plumose anemone) | Not Sensitive | Insufficient information | Not Sensitive | Not Sensitive* | |
Amphiura filiformis (brittlestar) | Very low | Low | Moderate | Not Sensitive* | |
Ophiothrix fragilis (Common brittlestar) | Very low | Insufficient information | Moderate | Low | |
Asterias rubens (Common starfish) | Low | Low | Moderate | Low | |
Henricia oculata (Bloody Henry starfish) | Very low | Insufficient information | Insufficient information | Insufficient information | |
Osilinus lineatus (Thick top shell) | Low | Insufficient information | Low | Low | |
Fucus vesiculosus (Bladder wrack) | Not Sensitive | Low | Low | Low | |
Fucus serratus (Toothed or serrated wrack) | Very low | Low | Low | Low | |
- Overall sensitivity rankings would suggest that the majority of key species have a low sensitivity to significant changes to the water quality of their water environment. Thekey exceptions are: Common Eelgrass (Zostera marina) to nutrients; Maerl (Phymatolithon calcareum) and Sweet Cup Coral (Leptopsammia pruvoti) to sediment; and the Native Oyster (Ostrea edulis) to heavy metals.
- A brief review of published survey information for the above named species within the Ramsar would suggest the individual species are not located in large populations close to the La Collette headland area. In the case of Common Eelgrass significant mapped populations tend to be located further out to sea ( Jackson , 2003), although theremay be areas found closer to shore but these have not been mapped.
- Mapping for Native Oyster populations within the Ramsar could not be found, although shellfish concession areas for the Pacific Oyster (Crassotrea gigas) are located off St. Clement Bay(some distance from the La Collette headland). In the case of Sweet Cup Corals, no reference to significant populations of this species within the Ramsar could be found.
- Within the Ramsar citation, the Maerl species is not specifically mentioned. However red seaweeds are mentioned in general terms in Plymouth Marine Laboratorys 2009 review of the Ramsar, but specific locations are not provided for comparison.
- As such, although the aforementioned species maybe located at distance from La Collette headland, they will still remain a consideration within any future impact assessments.
- Limited published research is available on tolerable water quality concentrations, however where such information did exist concentrations tended to be higher than UK marine Environmental Quality Standards (EQS) or UK Drinking Water Standards. As such screening against marine Environmental Quality Standards (or where these are not available for a substance, Drinking Water Standards) is considered to be a suitable and conservative approach to the assessment of potential impacts to the the wider water environment (including the Ramsar designated area to the south and east of the WMF).
- Table 2.11 (below) presents a compiled list of water quality standards used in the screening of baseline water quality results. For information, typical seawater concentrations (where known) are also listed for comparison. In some cases typical seawater concentrations may be in excess of the EQS.
Table 2.11: La Collette Water Quality Standards
Determinand | Units | Quality Standarda | Seawater concentrationb |
Inorganic contaminants | |||
SO4 | mg/l | 250c | 2,700 |
Cl | mg/l | 250c | 19,000 |
Nitrate as NO3 | mg/l | 50c |
|
un-ionised Ammonia (NH3-N)[1] | mg/l | 0.021 |
|
Metals | |||
As | µg/l | 25 (AA) | 3 |
Cd | µg/l | 2.5 (AA) | 0.1 |
Cr | µg/l | 15 (AA) | 0.05 |
Cu | µg/l | 5 (AA) | 3 |
Fe | mg/l | 1 (AA) | 0.0034d |
Hg | µg/l | 0.3 (AA) | 0.03 |
Mn | mg/l | 0.5e |
|
Ni | µg/l | 30 (AA) | 2 |
Pb | µg/l | 25 (AA) | 0.03 |
Zn | µg/l | 40 (AA) | 10 |
Organic hydrocarbons | |||
Benzene | µg/l | 30 (AA) 300 (MAC) |
|
Toluene | µg/l | 40 (AA) 400 (MAC) |
|
Ethylbenzene | µg/l | 30 |
|
Xylene | µg/l | 30 (AA) 300 (MAC) |
|
Mineral oils | µg/l | 600f |
|
Phenol | µg/l | 30 |
|
Napthalene | µg/l | 5 (AA) 200 (MAC) |
|
Benzo-a-pyrene | µg/l | 0.03 |
|
Anthracene | µg/l | 0.02 |
|
PAH (sum of 4 individual species)g | µg/l | 0.1c |
|
Dioxin (2,3,7,8-TCDD) | µg/l | 0.00003h |
|
Tetrahydrofuran | µg/l | 10 (PAL)h 50 (ES) |
|
a UK Environmental Quality Standards (marine) unless stated otherwise: AA = annual average; MAC = maximum
admissible concentration
b Table 16, WRc Ref: CO4028/1 WEB Report (Nov 1995)
c UK Drinking Water Standard
d Source: http://www.oceanplasma.org/documents/chemistry.html
e WHO drinking water standard
f Groundwater intervention value. Annex A of 2009 Soil Remediation Circular: Target values, soil remediation
intervention values and indicative levels for serious contamination.
g Sum of Benzo-b-fluoranthene, Benzo-k-fluoranthene, Benzo-ghi-perylene, and Indeno-123cd-pyrene
h Wisconsin groundwater quality standard (PAL = Preventative Action Limit; ES = Enforcement Standard)
 Summary of key points:
- Key potential contaminative sources that may influence water quality to the south and east of the La Collette Waste Management Facility include:
- Phase 2 below water inert waste.
- Remediated diesel spill in the former aggregate working area.
- Ash cells (and material stored on top of open cells).
- Historic unlined bulky waste pits.
- Green waste composting area.
- Energy from Waste / JEC Plant outfall.
- Ash cell liner integrity - basic water balance assessment suggests hydraulic containment is broadly performing within climatic expectations, with no indication of loss of leachate to underlying inert waste.
- Base elevation of ash cells a minimum of 1 m above maximum groundwater levels recorded.
- Phases 1 and 2 hydraulically de-linked by the presence of a high permeability landlocked former breakwater rock armour wall combined with lower permeability consolidated sands in Phase 1.
- Infiltration through the inert waste above the water table potentially limited where ash cells over-lap, truncating potential flowpaths.
- Tidal response in deeper piezometers (3 - 4 m range, 1½ hour lag time) indicates hydraulic connection between groundwater within the natural channel deposits below the inert waste and sea beyond the wall.
- Groundwater within inert waste below ash cells is hydraulically connected to sea beyond the high permeability rock armour wall, but responses vary across the WMF:
- West (BH1, BH2 and BH7) – little tidal variation (0.25 m range, 2 – 6 hours tidal lag), and groundwater levels consistently lower than to the east, suggesting limited interaction between sea and groundwater in this area.
- East (BH3, BH4 and BH5) – more dynamic groundwater environment (1-3 m range, 1½ - 3 hours tidal lag), suggesting greater interaction between sea and
groundwater than observed in western boreholes.
- Groundwater ingress into the site (3 – 5 hours) during high tide is both via the rock armour wall, and upwards from the natural channel deposits. Egress (6 – 9 hours) during low tide is via drainage through the inert waste, and out via the rock armour wall, with some movement out through the natural channel deposits.
- Hydraulic gradient varies during the tidal cycle with maxima (0.02 into the site at high tide,
- away from the site at low tide) only reached for a short time in the tidal cycle.
- Coastal waters identified as key receptor, with agreed use of coastal water quality standards for screening of monitoring results. Tolerable water quality concentrations observed to be higher than water quality standards.
- Key Ramsar species have low sensitivity to significant changes in water quality exception of Common Eelgrass (to nutrients), Maerl & Sweet Cup Coral (to sediments), Native Oyster (to heavy metals) which may be located at distance, but remain a consideration to assessments.
- Baseline Data Collection
- INTRODUCTION
- In the context of gathering data on baseline conditions, the drivers for a more comprehensive baseline water quality monitoring strategy were to:
- Characterise baseline water quality (including the influence of historic activities and inert waste disposal) against which any subsequent development proposals may be assessed.
- Act as a starting point for the differentiation of influences of the La Collette site on the the wider water environment (including the Ramsar designated area to the south and east of the WMF) from the influences of other activities within the surrounding area.
- Further inform our evolving knowledge of pathways & water movements (through consideration of physical and chemical data).
- Enable selection of a restricted number of representative determinands and locations for ongoing monitoring as part of operation of the waste management licence.
- In parallel to provide information for the derivation of appropriate Waste Acceptance Criteria if required in the future.
- Key aspects of the baseline monitoring are that:
- It has been focussed on chemical water quality only (i.e. there has been no biological components, biota monitoring or physical system monitoring such as sediment).
- It has been focussed on the identification of scale of influence (if any) of the waste management facility on the immediate wider water environment.
- The purpose of the baseline monitoring data collection exercise is to inform future activities.
- It further informs our conceptual knowledge for the site, but the monitoring is not intended to fully explain the complexities of the hydraulic regime.
- WATER QUALITY DETERMINANDS
- As highlighted in Section 2.2 a broad range of sources exist, both current and as a historical legacy, that may potentially have an influence on baseline water quality within the Site and the wider water environment. As such the list of determinands for which laboratory analysis was undertaken was kept deliberately broad for the baseline monitoring period:
- pH.
- Heavy metals – As, Cd, Cr (total and speciated), Cu, Fe (total and speciated), Mn, Hg, Zn, Pb, and V.
- Ammonia (NH3 as N) and Nitrate (plus Phosphate for the first few monitoring rounds).
- Cyanide (first few monitoring rounds only).
- Chloride and Sulphate.
- Dissolved organic carbon (DOC).
- Suspended and Dissolved Solids.
- Benzene, Toluene, Ethylbenzene and Xylene (BTEX).
- Phenol (total and individual).
- Speciated Total Petroleum Hydrocarbons (TPH).
- Speciated Polyaromatic Hydrocarbons (PAH).
- Field in-situ measurements of pH, electrical conductivity, redox potential, temperature and salinity were taken for each sample at the time of collection.
- The drafting of any subsequent operational water quality monitoring strategy encompassing a more focused laboratory determinand list will be informed by the results of the baseline monitoring period, and subsequent discussions between TTS and Environmental Protection departments.
- SAMPLING METHODOLOGY
- Following the first round of baseline water quality monitoring, the sampling locations originally proposed in February 2011 were revised to take account of the practicalities of sampling (including health and safety considerations) and / or the presence of water / leachate from which samples could be taken, whilst still maintaining a comprehensive spatial distribution of data collection points for the purposes of baseline characterisation.
- The revised set of sampling locations (as shown in Figure 8) took three days to sample with 1 / 2 monitoring personnel on site. When new boreholes were drilled for the purposes of informing ash cell engineering design, these were converted to groundwater monitoring wells and incorporated into the baseline monitoring plan. Monthly water sampling and laboratory analysis was undertaken up to, and including, August 2011 providing up to six months of consistent water quality data for baseline characterisation.
SURFACE WATERS
- Given the tidal nature of the site, surface water samples (including springs issuing from the inert waste (LAG) and sea water beyond the sea wall (SW)) were collected at low tide. Not only was this for health and safety reasons, but also to capture waters at the final time of exit from the Site with the least amount of potential dilution.
- Springs issuing from the inert waste into the lagoons were sampled as a snapshot representation of the wider influence of the waste onwater quality, in contrast to the point location nature of the boreholes.
GROUNDWATER
- Given that the site is effectively purged during every tidal cycle, and as such the likelihood of a borehole containing stagnant water of a quality not representative of the surrounding environment, it was felt that perhaps a standard borehole purging approach of removal of 3 well volumes may not be required at the site. In order to establish whether a 20 minute purge time was sufficient to allow in-situ water quality parameters to stabilize, several boreholes were purged with in-situ parameters recorded every 5 minutes over a 20 minute period (see Table 3.1 for detail).
Table 3.1: In-situ water quality parameters during 20 minute purging
| Reading 1 | Reading 2 | Reading 3 | Reading 4 | Reading 5 | Reading 6 |
Borehole 3d (High Tide, 25 litres removed) | ||||||
Time | 08:00 | 08:03 | 08:07 | 08:10 | 08:12 | 08:20 |
Temp (°C) | 12.4 | 14.8 | NR | NR | NR | NR |
pH | 12.1 | 8.1 | 7.53 | 7.3 | 7.3 | 7.3 |
Electrical Conductivity (µS/cm) | 7,550 | 23,300 | 44,200 | 47,800 | 46,500 | 47,700 |
Dissolved O2 (mg/l) | 8.16 | 7.71 | 6.70 | 5.50 | 6.20 | 5.08 |
Redox (mV) | -287 | -64 | -29 | -19 | -21 | -16 |
Salinity | 4.1 | NR | 28.1 | 30.5 | 29.7 | 29.8 |
Borehole 3d (Low Tide, 7.5 litres removed) | ||||||
Time | 14:05 | 14:10 | 14:15 | 14:20 |
|
|
Temp (°C) | 14.7 | NR | NR | NR |
|
|
pH | 7.6 | 7.8 | 7.8 | 7.6 |
|
|
Electrical Conductivity (µS/cm) | 48,500 | 48,500 | 49,900 | 48,600 |
|
|
Dissolved O2 (mg/l) | 5.68 | 5.21 | 5.14 | 5.41 |
|
|
Redox (mV) | -38 | -44 | -46 | -34 |
|
|
Salinity | 31.1 | 31.2 | 32.2 | 31.2 |
|
|
Borehole 1 (Mid Tide, 30 litres removed) | ||||||
Time | 10:00 | 10:05 | 10:10 | 10:15 | 10:20 |
|
Temp (°C) | 13.8 | 14.1 | 14.0 | 14.3 | 14.0 |
|
pH | 6.92 | 6.92 | 7.10 | 7.10 | 7.04 |
|
Electrical Conductivity (µS/cm) | 15,870 | 15,090 | 14,890 | 14,860 | 14,640 |
|
Dissolved O2 (mg/l) | 2.84 | 1.33 | 0.98 | 0.86 | 0.71 |
|
Redox (mV) | +5 | +4 | -3 | -4 | -2 |
|
Salinity | 9.1 | 8.7 | 8.5 | 8.5 | 8.4 |
|
Borehole 4s (Mid Tide, 28 litres removed) | ||||||
Time | 11:30 | 11:35 | 11:40 | 11:45 | 11:50 |
|
Temp (°C) | 12.3 | 11.0 | 11.2 | 11.1 | 11.3 |
|
pH | 7.60 | 7.59 | 7.63 | 7.63 | 7.62 |
|
Electrical Conductivity (µS/cm) | 53,400 | 54,100 | 54,300 | 53,700 | 54,000 |
|
Dissolved O2 (mg/l) | 2.54 | 2.20 | 2.46 | 2.48 | 2.27 |
|
Redox (mV) | -32 | -33 | -35 | -35 | -35 |
|
Salinity | 34.4 | 34.9 | 35.0 | 34.7 | 34.8 |
|
- A review of in-situ quality parameters during purging generally indicates a stabilisation of parameters after approximately 10 minutes of purging. As such continuation of a purge time restricted to 20 minutes for subsequent monitoring rounds was considered to be scientifically justifiable.
- To ensure sufficient water was available for sampling, and to enable sampling to continue when it was not possible to access the surface water monitoring points, groundwater samples were collected on the declining high tide. To check whether or not the time of sampling may have an influence on analytical results, during the April monitoring round samples were taken from the same borehole (BH3d) at different times of the day over two consecutive days. A summary of analytical results is detailed in Table 3.2.
Table 3.2: Water quality results for BH3d (4-5 April 2011)
Determinand | Units | 04/04/11 (High Tide) | 04/04/11 (Low Tide) | 05/04/11 (Mid Tide) | 05/04/11 (Low Tide) |
pH |
| 7.91 | 8.18 | 8.22 | 8.14 |
Total Suspended Solids | mg/l | 789 | 1,430 | 502 | 333 |
COD (unfiltered) | mg/l | 560 | 466 | 184 | 326 |
Nitrate as NO3 | mg/l | 0.68 | 0.30 | 0.09 | 5.15 |
Ammoniacal Nitrogen | mg/l | 28.0 | 13.3 | 28.0 | 22.4 |
Sulphate | mg/l | 1,150 | 1,860 | 1,250 | 1,480 |
Chloride | mg/l | 17,100 | 17,900 | 17,400 | 17,600 |
Heavy Metals | |||||
Arsenic | µg/l | 12.0 | 13.7 | 11.1 | 6.7 |
Cadmium | µg/l | 0.1 | 0.1 | 0.1 | 0.1 |
Chromium | µg/l | 1.5 | 1.5 | 1.5 | 1.5 |
Copper | µg/l | 2.0 | 3.0 | 3.7 | 2.3 |
Lead | µg/l | 0.2 | 0.2 | 0.2 | 0.2 |
Manganese | mg/l | 2.25 | 2.66 | 2.48 | 2.31 |
Nickel | µg/l | 9.2 | 8.9 | 11.5 | 3.7 |
Vanadium | µg/l | 8.0 | 8.6 | 5.5 | 4.5 |
Zinc | µg/l | 2.1 | 2.1 | 5.6 | 6.4 |
Mercury | µg/l | 0.15 | 0.15 | 0.15 | 0.15 |
Iron (saline) | mg/l | 0.08 | 0.04 | 0.07 | 0.04 |
Organics | |||||
Phenol (saline) | µg/l | 0.06 | 0.05 | 0.05 | 0.06 |
Total TPH | µg/l | 10 | 10 | 10 | 10 |
Total PAH (USEPA 16) | µg/l | 2.24 | 2.59 | 5.59 | 1.07 |
- Comparison of analytical results for groundwater samples taken at different times within the tidal cycle broadly shows consistency in results, suggesting that the time of sampling is less likely to have a critical influence on the nature of the water quality results.
ASH CELLS
- Given the ash cells (and hence the dip tubes) are located above the water table, and as such disconnected from the tidal cycle, the timing of sampling was not considered to be critical. As such ash cell samples were collected at times when it was not possible to collect groundwater or surface water samples.
QUALITY ASSURANCE
- For quality assurance (QA) purposes duplicate and blank samples (containing mineral water) were sent to the laboratory (Alcontrol) during the April 2011 monitoring round. Analytical results for the duplicate samples were within appropriate limits of the original sample.
- Blank QA samples did not indicate any concentrations of concern attributable to analytical equipment not being cleaned sufficiently.
 Summary of key points:
- Baseline characterisation water quality monitoring was undertaken to inform subsequent assessment of development proposals, and the drafting of a focussed operational monitoring plan for water quality.
- 42 monitoring locations (covering the main source-pathway-receptor linkages) were sampled monthly for up to 6 months, and analysed for 75+ determinands reflecting a broad range of potential sources.
- Surface water and inert waste spring samples were collected at low tide, groundwater samples on the declining high tide, and ash cell samples at any point of the tidal cycle given the fact that the cells are located above the water table.
- In situ readings of pH, electrical conductivity, temperature and salinity were taken for each water sample.
- Boreholes were purged for 20 minutes before sampling, with in-situ quality parameters generally stabilising after 10 minutes.
- Groundwater quality did not vary significantly during the tidal cycle, as such sampling was not time dependent from a quality point of view.
- Results
- INTRODUCTION
- A full set of in-situ water quality results and laboratory analytical results can be found in Appendices C and D respectively. Statistical summary tables (documenting minimum, maximum and average concentrations for the 3 - 6 month monitoring period) for in-situ water quality parameters and laboratory determinands can be found in Appendix E.
- Spatial plots of the average monitoring results for key determinands can be found in Appendix A (Figures 9 to 17).
- IN-SITU WATER QUALITY
- Between October 2010 and August 2011, in-situ monitoring of: temperature; pH; redox; electrical conductivity; total dissolved solids; salinity; and dissolved oxygen has been undertaken. Key results for the ash cells, groundwater monitoring wells, springs issuing from the inert waste, and sea water beyond the sea wall are discussed below.
SALINITY
- Baseline average salinity results (Figure 9) for surface water beyond the sea wall ranged from 33.27 to 35.34, with minimal variation during the monitoring period. Spatially the results were consistent around the SW monitoring points, with only SW20 and SW22 exhibiting lower salinity readings than the remainder of the monitoring points around La Collette.
- With respect to the springs issuing from the inert waste (LAG monitoring points), salinity readings are observed to be essentially the same as the sea water monitoring points. In terms of groundwater there is a contrast between salinities recorded in the eastern boreholes BH3d, BH4s and BH6 (29.91 – 34.36 average) and those recorded in western boreholes BH1 and BH7 (9.15 – 16.37 average). Eastern boreholes record salinities similar to sea water, suggesting potential good hydraulic connection to sea water, whilst those of the western boreholes are significantly lower, potentially suggesting a reduced hydraulic connection to tidal influx.
- In respect of the ash cells (DT monitoring points) recorded salinities vary greatly between individual cells. Salinities of the cells containing older ash tend to be lower than those containing younger ash (with the exception of Cell 6 in the Northern Mound).
ELECTRICAL CONDUCTIVITY
- Electrical conductivity (EC) is a useful water quality parameter as an indicative measure of the total concentration of dissolved ions in water. Seawater tends to have very high concentrations of dissolved ions (predominantly sodium and chloride), and as such EC levels can be naturally high. Baseline average EC results (Figure 10) for surface water beyond the sea wall ranged from 51,767 µS/cm (SW20) to 54,440 µS/cm (SW2), with minimal variation during the monitoring period. Spatially the results were consistent around the SW monitoring points, with only SW20 and SW22 exhibiting lower EC readings than the remainder of the monitoring points around La Collette.
- With respect to the springs issuing from the inert waste (LAG monitoring points), EC readings are observed to be essentially the same as the sea water monitoring points. In terms of groundwater there is a contrast between EC recorded in the eastern boreholes BH3d, BH4s and BH6 (46,771 µS/cm – 53,486 µS/cm average) and those recorded in western boreholes BH1 and BH7 (15,912 µS/cm – 26,993 µS/cm average). Eastern boreholes record EC similar to sea water, suggesting potential good hydraulic connection to sea water, whilst those of the western boreholes are significantly lower than sea water, potentially suggesting a reduced hydraulic connection to tidal influx.
- In respect of the ash cells (DT monitoring points) recorded ECs vary greatly between individual cells, suggesting hydraulic disconnection between the cells (i.e. liner integrity). Within the older ash cells (8 – 15 years old) of the Northern Mound, with the exception of Cell 6, EC readings were significantly lower than seawater or groundwater (ranging from averages of 3,442 µS/cm to 20,447 µS/cm). The average EC recorded for Cell 6 was 57,660 µS/cm.
- For more recent ash cells (<1 – 8 years) in the current waste management facility, the majority of cells record EC levels around or less than those of baseline sea water. Exceptions include a few ash cells where high levels of EC have been recorded:
- Cell 25 (average 77,050 µS/cm, maximum 97,700 µS/cm).
- Cell 27 (average 60,880, µS/cm, maximum 112,900 µS/cm).
- Cell 29 (average 106,090 µS/cm, maximum 116,400 µS/cm).
- Reasons for the elevated EC levels maybe related to activities other than ash disposal taking place on top of the lined ash cells, or in ash cells higher up. Review of concentrations of individual determinands (described later within this Section) may provide some explanation.
- Alternatively it maybean indication that fresh (1 – 2 years) ash leachate (average 24,244 µS/cm to 36,199 µS/cm) tends to mature reaching a peak EC between 3 - 7 years (average 60,490 µS/cm to 77,050 µS/cm), before declining after 8+ years (average 3,442 µS/cm to 20,447 µS/cm).
PH AND REDOX
- Reduction / oxidation potential (redox) is a measure of the tendency of a species to acquire (or lose) electrons becoming reduced (or oxidised) in the process. Measured in mV, negative redox readings are indicative of reducing conditions, whilst positive readings are indicative of oxidising conditions. In combination with pH, the majority of chemical degradation reactions are driven by redox conditions. For example heavy metals tend to require acidic, reducing conditions to remain insolution. Hydrocarbons, ammonium etc tend to require oxidising conditions to degrade to other hydrocarbons or nitrates. Measuring pH and redox conditions gives a broad indication of the potential degradation environment and circumstances driving chemical reactions.
- In terms of the wider sea water environment pH remains relatively consistent spatially (Figure 11) and temporally, fluctuating marginally between slightly acidic to slightly alkaline (6.14 to 8.70). Redox recorded tended to show that SW monitoring point waters were on average marginally reducing (average -64mV to -29mV), with some occasional marginally oxidising conditions recorded as maxima (up to +46 mV).
- Springs issuing from the inert waste were neutral to slightly alkaline (7.35 to 8.06), within the range of seawater. Redox levels recorded ranged from -77 mV to -26 mV, marginally reducing conditions of a similar scale to seawater.
- With respect to groundwater generally boreholes, with the exception of BH1, recorded near neutral pH (6.95 to 7.87) and slightly reducing conditions (-56mV to +2 mV). Within BH1 pH was slightly more acidic (6.5 to 7.2), with redox levels marginally higher than recorded in other boreholes (-15mV to +8 mV).
- Within the ash cells pH and redox levels varied significantly between cells, potential evidence of hydraulic disconnection. With the exception of Cell 6, ash cell leachate within the Northern Mound (ash deposits being 10 – 15 years old) exhibited neutral to marginally alkaline pH conditions (6.83 to 8.96) combined with a marginally reducing redox environment (-114 mV to -14 mV). Leachate within Cell 6 was found to be more alkaline (pH 7.5 - 11.89) and more reducing (-248mV to – 48 mV) than other cells within the Northern Mound.
- To the south pH and redox readings varied between individual cells with little evidence for trends that maybe related to: the age of the ash; whether the cell is open or closed; or whether the cell is being actively pumped. Results are summarised in Table 4.1 below.
Table 4.1: pH and Redox statistics for southern ash cells
Cell No. |
|
|
| pH | Redox (mV) | ||||
Min | Average | Max | Min | Average | Max | ||||
16 | 10 - 11 | Closed | Not pumped | 7.50 | 10.28 | 11.89 | -248 | -190 | -48 |
18 | 9 - 10 | Closed | Not pumped | 7.23 | 7.98 | 8.60 | -109 | -66 | -48 |
21 | 8 – 9 | Closed? | Not pumped | 6.10 | 7.91 | 8.90 | -111 | -61 | +49 |
22 | 7 – 8 | Open | Pumped | 7.63 | 8.65 | 10.04 | -198 | -102 | -41 |
23 | 6 - 7 | Closed | Not pumped | 7.64 | 8.65 | 10.38 | -218 | -103 | -37 |
24 | 5 - 6 | Open | Pumped | 10.47 | 11.20 | 11.90 | -305 | -248 | -185 |
25 | 5 – 6 | Open | Pumped | 8.76 | 9.87 | 11.03 | -216 | -171 | -109 |
26 | 3 – 4 | Open | Pumped | 7.50 | 9.92 | 11.45 | -256 | -174 | -57 |
27 | 3 – 4 | Open | Pumped | 6.86 | 7.69 | 8.63 | -92 | -49 | -13 |
28 | <1 | Open | Pumped | 6.77 | 7.44 | 8.50 | -83 | -33 | +11 |
29 | 1 – 2 | Open | Pumped | 6.54 | 7.18 | 8.24 | -64 | -20 | +4 |
31 | <1 – 2 | Open | Pumped | 7.32 | 9.03 | 10.81 | -208 | -119 | -44 |
32 | 1 – 2 | Open | Pumped | 7.90 (32N) 7.75 (32S) | 9.05 (32N) 8.29 (32S) | 11.30 (32N) 9.20 (32S) | -244 (32N) -151 (32S) | -127 (32N) -82 (32S) | -58 (32N) -51 (32S) |
- Overall the ash cells exhibit near neutral pH with marginally reducing conditions, except for Cells 16, 23, 24, 25, 26, 31 and 32 where strongly alkaline pHs and stronger reducing conditions are recorded.
- Monitoring of different dip tubes (32N and 32S) within the same cell showed some variation between pH and redox readings. Potentially such heterogeneity may be indicative of perched leachate pockets within the waste.
- HEAVY METALS
- Environmental Quality Standards (EQS) for heavy metals listed in Table 2.11 are for comparison to Annual Average (AA) concentrations. Conservatively all results have been screened against these AA Environmental Quality Standards – with exceedences highlighted in red within the data results tabulated in Appendix E.
- For convenience Table 4.2 below documents the average concentration of individual heavy metal determinands recorded during the baseline water quality monitoring period against EQS. Table 4.3 summarises the numbers of EQS exceedences out of the total number of monitoring points sampled.
Table 4.2: Average dissolved heavy metal concentrations recorded during baseline monitoring period
Heavy metal | EQS | Ash Cell Dip Tube Reference | |||||||||||||||||
|
| DT1 | DT3 | DT4 | DT6 | DT11 | DT16S | DT18 | DT21 | DT22 | DT23S | DT24W | DT25S | DT26 | DT27N | DT28S | DT29N | DT31N | DT32N |
As (µg/l) | 25 µg/l | 15.19 | 13.83 | 19.38 | 48.69 | 63.56 | 55.80 | 143.0 | 71.4 | 181.0 | 127.1 | 83.61 | 83.74 | 132.1 | 41.35 | 88.18 | 26.88 | 70.63 | 13.41 |
Cd (µg/l) | 2.5 µg/l | 0.1 | 0.11 | 0.23 | 0.32 | 0.40 | 0.63 | 0.21 | 0.49 | 0.48 | 1.43 | 1.42 | 1.95 | 1.49 | 0.92 | 0.40 | 0.31 | 0.91 | 1.68 |
Cr (µg/l) | 15 µg/l | 22.34 | 9.91 | 12.17 | 16.40 | 10.23 | 2.22 | 5.50 | 4.58 | 16.32 | 9.11 | 3.74 | 5.23 | 4.28 | 22.92 | 25.28 | 43.10 | 9.05 | 4.76 |
Cu (µg/l) | 5 µg/l | 5.35 | 4.71 | 34.56 | 10.79 | 5.62 | 4.61 | 4.55 | 3.53 | 17.64 | 12.78 | 108.78 | 27.66 | 22.08 | 27.39 | 12.45 | 55.37 | 21.57 | 48.96 |
Pb (µg/l) | 25 µg/l | 0.24 | 4.17 | 2.88 | 5.97 | 0.75 | 3.18 | 2.51 | 0.21 | 0.87 | 1.96 | 6.65 | 0.56 | 1.49 | 0.79 | 1.31 | 0.47 | 3.34 | 0.93 |
Mn (µg/l) | 500 µg/l | 494 | 100 | 3.34 | 4,591 | 211 | 8.71 | 55.14 | 257 | 24.80 | 106 | 6.27 | 42.07 | 9.39 | 60.16 | 176 | 1,077 | 91.11 | 100 |
Ni (µg/l) | 30 µg/l | 16.4 | 14.58 | 12.74 | 149 | 58 | 91 | 13.14 | 14.98 | 547 | 54 | 326 | 302 | 360 | 73 | 24 | 55 | 295 | 484 |
V (µg/l) | 100 µg/l | 8.46 | 5.53 | 9.23 | 16.06 | 7.90 | 6.31 | 4.90 | 1.64 | 40.06 | 2.69 | 14.98 | 6.20 | 11.65 | 21.78 | 7.02 | 16.59 | 5.41 | 13.58 |
Zn (µg/l) | 40 µg/l | 5.46 | 12.43 | 21.10 | 9.18 | 18.45 | 4.78 | 7.05 | 3.18 | 8.89 | 6.72 | 9.97 | 5.00 | 12.22 | 9.62 | 9.61 | 4.33 | 4.59 | 11.13 |
Hg (µg/l) | 0.3 µg/l | 0.04 | 0.03 | 0.04 | 0.03 | 0.04 | 0.04 | 0.04 | 0.04 | 0.04 | 0.04 | 0.18 | 0.18 | 0.04 | 0.04 | 0.04 | 0.05 | 0.12 | 0.47 |
Fe total (mg/l) | 1 mg/l | 4.8 | 0.08 | 0.02 | 0.67 | 0.33 | 0.05 | 0.09 | 0.59 | 0.02 | 0.06 | 0.15 | 0.27 | 0.02 | 0.05 | 0.07 | 0.67 | 2.60 | 0.99 |
Heavy metal | EQS | Groundwater Monitoring Well Reference |
| Issuing to Western Lagoon | Issuing to Eastern Lagoon | ||||||||||||||
|
| BH1 | BH2d | BH3s | BH3d | BH4s | BH5 | BH6 20 | BH6 50 | BH7 |
| LAG1 | LAG2 | LAG3 | LAG4 | LAG5 | |||
As (µg/l) | 25 µg/l | 66.52 | 33.53 | 17.61 | 11.10 | 0.91 | 41.43 | 5.59 | 13.20 | 66.04 |
| 2.02 | 2.85 | 6.96 | 7.71 | 2.48 | |||
Cd (µg/l) | 2.5 µg/l | 0.34 | 0.49 | 0.69 | 0.66 | 0.28 | 1.62 | 0.35 | 2.57 | 0.74 | 0.22 | 0.22 | 0.20 | 0.30 | 0.25 | ||||
Cr (µg/l) | 15 µg/l | 17.00 | 11.07 | 17.65 | 7.49 | 11.40 | 15.73 | 11.87 | 24.50 | 44.47 | 1.50 | 2.67 | 3.09 | 2.78 | 1.50 | ||||
Cu (µg/l) | 5 µg/l | 3.01 | 18.20 | 27.80 | 4.06 | 15.30 | 9.16 | 8.87 | 9.76 | 7.96 | 2.34 | 4.23 | 5.17 | 4.26 | 2.76 | ||||
Pb (µg/l) | 25 µg/l | 0.21 | 1.37 | 0.64 | 1.13 | 0.51 | 2.60 | 0.73 | 6.51 | 0.77 | 0.45 | 0.46 | 0.50 | 0.59 | 0.40 | ||||
Mn (µg/l) | 500 µg/l | 1,393 | 1,333 | 2,115 | 2,234 | 62.14 | 4,403 | 32.00 | 12.20 | 3,657 | 1.24 | 22.11 | 285 | 2.55 | 2.74 | ||||
Ni (µg/l) | 30 µg/l | 15.31 | 14.31 | 18.60 | 9.38 | 14.29 | 15.60 | 11.48 | 12.30 | 20.00 | 3.97 | 5.03 | 6.58 | 4.92 | 2.85 | ||||
V (µg/l) | 100 µg/l | 10.21 | 4.87 | 4.53 | 7.81 | 2.84 | 13.77 | 19.28 | 2.54 | 13.81 | 5.05 | 4.89 | 5.58 | 5.90 | 5.17 | ||||
Zn (µg/l) | 40 µg/l | 8.14 | 39.98 | 28.00 | 23.00 | 19.59 | 12.16 | 29.57 | 19.00 | 9.08 | 23.45 | 19.65 | 23.83 | 28.97 | 20.88 | ||||
Hg (µg/l) | 0.3 µg/l | 0.06 | 0.06 | 0.01 | 0.13 | 0.07 | 0.06 | 0.06 | 0.01 | 0.01 | 0.15 | 0.13 | 0.13 | 0.14 | 0.16 | ||||
Fe total (mg/l) | 1 mg/l | 58.1 | 1.73 | 0.02 | 45.7 | 91.1 | 63.80 | 2.29 | 1.11 | 6.05 | 34.4 | 49.4 | 122 | 143 | 34.4 | ||||
Table 4.2 continued: Average dissolved heavy metal concentrations recorded during baseline monitoring period
Heavy metal | EQS | Surface Water Beyond Sea Wall Monitoring Point Reference | EfW facility outfall | ||||||||||
SW1 | SW2 | SW4 | SW6 | SW8 | SW10 | SW12 | SW14 | SW18 | SW20 | SW22 | SW16 | ||
As (µg/l) | 25 µg/l | 1.63 | 1.83 | 1.89 | 1.78 | 1.87 | 1.89 | 1.72 | 1.84 | 2.03 | 2.80 | 2.80 | 2.29 |
Cd (µg/l) | 2.5 µg/l | 0.31 | 0.28 | 0.26 | 0.35 | 0.29 | 0.27 | 0.26 | 0.23 | 0.22 | 0.21 | 0.21 | 0.18 |
Cr (µg/l) | 15 µg/l | 1.50 | 1.50 | 1.79 | 1.63 | 2.31 | 1.56 | 1.83 | 1.50 | 1.50 | 5.66 | 1.50 | 4.77 |
Cu (µg/l) | 5 µg/l | 2.76 | 1.88 | 2.39 | 2.91 | 5.20 | 4.68 | 2.24 | 2.53 | 4.55 | 2.49 | 4.70 | 8.82 |
Pb (µg/l) | 25 µg/l | 0.61 | 1.07 | 0.55 | 0.86 | 0.61 | 1.93 | 0.53 | 1.33 | 0.43 | 0.86 | 0.39 | 0.48 |
Mn (µg/l) | 500 µg/l | 0.30 | 0.30 | 1.24 | 0.30 | 0.30 | 1.39 | 0.30 | 2.03 | 1.56 | 5.34 | 43.11 | 1.20 |
Ni (µg/l) | 30 µg/l | 2.13 | 1.98 | 4.00 | 2.03 | 2.47 | 2.29 | 2.02 | 2.53 | 2.00 | 2.85 | 2.80 | 10.05 |
V (µg/l) | 100 µg/l | 4.28 | 4.60 | 4.52 | 4.23 | 4.13 | 4.24 | 4.22 | 4.48 | 4.51 | 5.47 | 5.56 | 2.89 |
Zn (µg/l) | 40 µg/l | 14.10 | 16.42 | 13.33 | 18.28 | 20.40 | 39.95 | 16.29 | 11.35 | 8.90 | 31.73 | 15.80 | 31.85 |
Hg (µg/l) | 0.3 µg/l | 0.16 | 0.15 | 0.15 | 0.17 | 0.20 | 0.18 | 0.18 | 0.15 | 0.15 | 0.15 | 0.15 | 0.08 |
Fe total (mg/l) | 1 mg/l | 33.7 | 34.9 | 86.5 | 37.7 | 33.0 | 34.5 | 32.8 | 40.4 | 37.8 | 65.1 | 63.8 | 0.02 |
Table 4.3: Number of monitoring points where average concentrations exceeded EQS
Heavy metal | EQS | Ash Cells (DT) | Groundwater (BH) | Waste Springs (LAG) | Surface Water (SW) | ||||
|
| Exceedences | No. Monitoring points | Exceedences | No. Monitoring points | Exceedences | No. Monitoring points | Exceedences | No. Monitoring points |
As (µg/l) | 25 µg/l |
|
|
|
| ||||
Cd (µg/l) | 2.5 µg/l |
|
|
|
| ||||
Cr (µg/l) | 15 µg/l |
|
|
|
| ||||
Cu (µg/l) | 5 µg/l |
|
|
|
| ||||
Pb (µg/l) | 25 µg/l |
|
|
|
| ||||
Mn (µg/l) | 500 µg/l |
|
|
|
| ||||
Ni (µg/l) | 30 µg/l |
|
|
|
| ||||
V (µg/l) | 100 µg/l |
|
|
|
| ||||
Zn (µg/l) | 40 µg/l |
|
|
|
| ||||
Hg (µg/l) | 0.3 µg/l |
|
|
|
| ||||
Fe total (mg/l) | 1 mg/l |
|
|
|
| ||||
SURFACE WATER BEYOND SEA WALL
- Average concentrations, and most maxima, for the majority of heavy metals (As, Cd, Cr, Pb, Mn, Ni, V, Hg and Zn) were found to be below EQS during the baseline monitoring period.
- Two out of the twelve monitoring points (SW8 and SW16) recorded average Cu concentrations (5.2 µg/l and 8.8 µg/l) that marginally exceeded EQS (5 µg/l). With respect to Zn (Figure 12), average concentrations did not exceed EQS (40 µg/l) but averages at a few monitoring points were above 30 µg/l (SW10 = 39.95 µg/l, SW20 = 31.73 µg/l; SW16 =
31.85 µg/l).
- In the case of average Fe concentrations (Figure 13), widespread exceedence of the EQS (1 mg/l) during the baseline monitoring period was observed. OnlySW16 (EfW outfall) recorded average Fe concentrations below the EQS. As noted in Capita Symonds Stage 1: Report (Sept 2010) some waters may be naturally high in certain trace metals (including Fe) due to the diorite geology. Open water samples taken at high tide from a transect between La Collette and Demi de Pas in April 2009 recorded Fe within a 10 – 50 µg/l range[1].
- Monitoring location SW1 (located at the north west corner of the sea wall) represents the furthest sampling point away from the waste deposits or other headland activities. As such it maybe regarded as potentially representing a localised natural baseline location to which other monitoring point concentrations may be compared to. Average Fe concentration recorded atSW1 during the baseline monitoring period was 33.7 mg/l.
- The majority of surface water monitoring points around the extent of the sea wall recorded average Fe concentrations similar to or slightly higher than baseline. Monitoring points recording average Fe concentrations greater than 40 mg/l, and therefore potentially an additional component of Fe to the wider water environment, include: SW4 (86.5 mg/l); SW14 (40.4 mg/l); SW20 (65.1 mg/l) and SW22 (63.8 mg/l).
WASTE SPRINGS
- Average concentrations, and most maxima, for the majority of heavy metals (As, Cd, Cr, Pb, Mn, Ni, V, Hg and Zn) were found to be below EQS during the baseline monitoring period.
- One out of the five monitoring points (LAG3) recorded an average Cu concentration (5.17 µg/l) that marginally exceeded EQS (5 µg/l). With respect to Zn, average concentrations did not exceed EQS (40 µg/l) but were in the range of 20 – 30 µg/l – similar in scale to those recorded in surface water beyond the sea wall.
- With respect to Fe, all monitoring points recorded average concentrations in exceedence of EQS. Monitoring points LAG1 and LAG5 showed similar average concentrations to baseline (SW1), with LAG2 marginally higher than baseline with an average of 49.4 mg/l. However average Fe concentrations recorded at monitoring points LAG3 (122 mg/l) and LAG4 (143 mg/l) were approximately 2 – 3 times that of baseline.
- Heavy metal concentrations recorded at monitoring point LAG3 were generally found to be much higher than those recorded at the other four waste spring monitoring points.
GROUNDWATER
- Average concentrations for Pb, Ni, V, Zn and Hg were found to be below EQS during the baseline monitoring period. Exceedence of EQS by average concentrations of the other heavy metals was not observed tobe widespread, being confined to certain boreholes.
- With respect to As, average exceedences were noted in BH1 (67 µg/l), BH2d (34 µg/l), BH5 (41 µg/l) and BH7 (66 µg/l) but not in the eastern boreholes. For Cd, a single marginal average exceedence in BH6 (2.6 µg/l) is noted.
- In the case of Cr, some average exceedences were marginal (BH1 = 17 µg/l, BH3s = 18 µg/l, and BH5 = 16 µg/l) whilst those recorded in BH6 (25 µg/l) and BH7 (45 µg/l) were higher. Marginal exceedences with respect to Cu are also noted in BH5 (9 µg/l), BH6 (9-10 µg/l) and BH7 (9 µg/l), compared to higher average exceedences noted in BH2d (18 µg/l), BH3s (28 µg/l) and BH4s (15 µg/l).
- With respect to Zn, average concentrations did not exceed EQS but averages at a few monitoring points were either close (BH2d, 39.98 µg/l) or near to30 µg/l (BH3s and BH6).
- Average Mn concentrations were observed to be 3 – 8 times EQS in six of the nine monitoring points, ranging from 1,333 µg/l (BH2d) to 4,403 µg/l (BH5). No such exceedences were noted in BH4 or BH6, nor in samples taken from the waste springs.
- With respect to Fe, seven monitoring points recorded average concentrations in exceedence of EQS. Average concentrations marginally above EQS were recorded in BH2d (1.7 mg/l), BH6 (1.1 – 2.3 mg/l) and BH7 (6.1 mg/l), whilst averages significantly greater than EQS were noted in BH1 (58.1 mg/l), BH3d (45.7 mg/l), BH4s (91.1 mg/l) and BH5 (63.8 mg/l). Although such average concentrations were above the baseline recorded at SW1, they were not as high as the average concentrations recorded at LAG3 and LAG4 waste springs.
ASH CELLS
- Average concentrations for Cd, Pb, V and Zn were found tobe below EQS during the baseline monitoring period. Average concentrations of As, Cu and Ni showed widespread exceedence of EQSs through the ash cells monitored, whilst exceedence of EQS by average concentrations of the other heavy metals was confined toonly a few ash cells.
- With respect to As, in the older Northern Mound average exceedences were only noted in Cell 6 (49 µg/l) and Cell 11 (64 µg/l). Younger ash in the southern area noted average concentrations exceeding EQS (25 µg/l) in: Cell 16 (56 µg/l); Cell 18 (143 µg/l); Cell 21 (71 µg/l); Cell 22 (181 µg/l); Cell 23 (127 µg/l); Cell 24 (84 µg/l); Cell 25 (84 µg/l); Cell 26 (132 µg/l); Cell 27 (41 µg/l); Cell 28 (88 µg/l); Cell 29 (27 µg/l); and Cell 31 (71 µg/l).
- Average Cu concentrations exceeded EQS (5 µg/l) in the Northern Mound in Cell 11 (6 µg/l), Cell 4 (35 µg/l) and Cell 6 (11 µg/l). To the south, averages exceeded EQS in: Cell 22 (18 µg/l); 23 (13 µg/l); 24 (109 µg/l); 25 (28 µg/l); 26 (22 µg/l); 27 (27 µg/l); 28 (12 µg/l); 29 (55 µg/l); 31 (22 µg/l); and 32 (49 µg/l). Cell 24, showing higher Cu than other ash cells, is being used for bannelais storage which may have an additional contributory influence.
- With respect to Ni,in the Northern Mound average exceedences of EQS (30 µg/l) were only noted in Cell 6 (149 µg/l) and Cell 11 (58 µg/l). To the south, average concentration exceedences were noted in: Cell 16 (91 µg/l); Cell 22 (547 µg/l); Cell 23 (54 µg/l); Cell 24 (326 µg/l); Cell 25 (302 µg/l); Cell 26 (360 µg/l); Cell27 (73 µg/l); Cell 29 (55 µg/l); Cell 31 (296 µg/l); and Cell 32 (484 µg/l).
- Marginal exceedences of EQS (15 µg/l) of average concentrations of Cr were recorded in the Northern Mound (Cell 1 = 22 µg/l, Cell 6 = 16 µg/l), together within some cells of the southern area (Cell 22 = 22 µg/l, Cell 27 = 23 µg/l, and Cell 29 = 25 µg/l). Only Cell 29 recorded an average concentration (43 µg/l) significantly higher than EQS.
- With respect to Hg, only one cell (Cell 32) recorded an average concentration (0.47 µg/l) that marginally exceeded EQS (0.3 µg/l). Average concentrations of Hg in all other ash cells were found to be below EQS.
- Fe and Mn concentrations within the ash cells were generally significantly less than those found in underlying groundwater. Annual average concentrations only exceeded EQS in isolated ash cells: Cells 6 and 29 in the case of Mn; and Cells 1 and 31 in the case of Fe.
- Overall heavy metal concentrations recorded within the ash cells were found to be at the low end of the range of metal concentrations recorded byWRc during their 2003 and 2007 leaching tests (discussed in paragraph 2.2.6 onwards), potentially reflecting the difference between pH of the fresh leachate from the WRc tests (10.5 – 12.5) and the pH of leachate within the ash cells (generally 7 – 9 with some cells up to a pH of 10 – 11).
- NUTRIENTS
- Average concentrations recorded for Ammonium (unionised), Nitrate and Phosphate during the baseline monitoring period are detailed in Table 4.4 below and discussed in subsequent paragraphs.
![]()
![]() 4/Results
4/Results
Table 4.4: Average nutrient concentrations (mg/l) recorded during baseline monitoring period
Nutrient |
| Ash Cell Dip Tube Reference | ||||||||||||||||||
DT1 | DT3 | DT4 | DT6 | DT11 | DT16S | DT18 | DT21 | DT22 | DT23S | DT24W | DT25S | DT26 | DT27N | DT28S | DT29N | DT31N | DT32N | |||
Ammonium (NH3-N), unionised | 0.021 mg/l | 1.51 | 7.08 | 0.27 | 281 | 38.61 | 35.94 | 36.87 | 6.45 | 294 | 65.86 | 95.52 | 166 | 172 | 73.03 | 146 | 111 | 101 | 73.83 | |
Nitrate as NO3 | 50 mg/l | 0.46 | 8.84 | 12.45 | 0.30 | 12.42 | 0.30 | 3.69 | 9.05 | 0.32 | 0.24 | 0.47 | 0.30 | 0.30 | 0.30 | 5.98 | 0.30 | 0.30 | 0.74 | |
Phosphate as PO4 | No standard | 0.10 | 1.57 | 1.95 | 2.26 | 0.51 | 0.17 | 0.05 | 0.13 | 0.18 | 2.18 | 0.08 | 0.10 | 0.76 | 0.14 | 5.02 | 0.24 | 0.42 | 0.05 | |
Nutrient |
| Groundwater Monitoring Well Reference |
| Issuing to Western Lagoon | Issuing to Eastern Lagoon | |||||||||||||||
BH1 | BH2d | BH3s | BH3d | BH4s | BH5 | BH6 20 | BH6 50 | BH7 |
| LAG1 | LAG2 | LAG3 | LAG4 | LAG5 | ||||||
Ammonium (NH3-N), unionised | 0.021 mg/l | 25.18 | 4.19 | 2.91 | 18.99 | 3.22 | 9.86 | 1.07 | 3.87 | 24.89 |
| 0.92 | 1.07 | 2.63 | 0.61 | 0.83 | ||||
Nitrate as NO3 | 50 mg/l | 0.24 | 2.10 | 0.30 | 1.14 | 0.91 | 0.23 | 0.70 | 0.30 | 0.30 | 0.30 | 0.24 | 0.52 | 0.74 | 1.18 | |||||
Phosphate as PO4 | No standard | 1.64 | Not analysed | 1.03 | 0.55 | 0.19 | Not analysed | Not analysed | Not analysed | Not analysed | 0.05 | 0.14 | 0.77 | 0.18 | 0.12 | |||||
Nutrient |
| Surface Water Beyond Sea Wall Monitoring Point Reference | EfW facility outfall |
| ||||||||||||||||
SW1 | SW2 | SW4 | SW6 | SW8 | SW10 | SW12 | SW14 | SW18 | SW20 | SW22 | SW16 |
| ||||||||
Ammonium (NH3-N), unionised | 0.021 mg/l | 0.74 | 0.84 | 0.84 | 0.59 | 0.57 | 0.65 | 0.77 | 0.63 | 0.39 | 0.62 | 1.09 | 0.55 |
| ||||||
Nitrate as NO3 | 50 mg/l | 0.26 | 0.28 | 0.28 | 0.37 | 0.40 | 0.39 | 0.29 | 0.76 | 1.02 | 2.65 | 0.94 | 0.57 | |||||||
Phosphate as PO4 | No standard | 0.05 | 0.05 | 0.05 | 0.05 | 0.05 | 0.05 | 0.05 | 0.09 | 0.09 | 0.09 | 0.17 | 0.05 | |||||||
XX = above Water Quality Standard. XX = below detection limit.
La Collette Baseline Water Quality Review 39 Version 3 CS/049696-07-01 November 2011
AMMONIUM AND NITRATE
- The Environmental Quality Standard (annual average, saltwater) for unionized Ammonium (0.021 mg/l) is very low. As such all concentrations recorded tended to fail the standard. Nitrate concentrations were all below the water quality standard of 50 mg/l(UKDrinking Water Standard), but this standard is very high and not directly applicable to an environmental setting (although in the absence of another standard has been used).
- In order to review the data more sensibly, comparison will be madeto the baseline surface water monitoring point SW1 which, as described in paragraph 4.3.6, is considered to represent a localized natural baseline location. Average Ammonium concentration recorded at SW1 during the baseline monitoring period was 0.74 mg/l, with an average Nitrate concentration of 0.26 mg/l. Figure 14 provides a spatial plots of average Ammonium and Nitrate concentrations.
Surface Water Beyond the Sea Wall
4.4.4 Beyond the sea wall, average recorded concentrations of Ammonium and Nitrate (0.39 mg/l
– 0.84 mg/l) were generally similar to (or less than) those recorded at the local natural baseline monitoring point of SW1. A slightly higher than baseline average concentration (1.09 mg/l) was only recorded at SW22 at the furthest north east point of the Northern Mound. Average Nitrate concentrations recorded for monitoring points SW2 – SW12 were similar to natural baseline, but higher than baseline for other surface water monitoring points. In particular SW18 and SW20 recorded much higher average concentrations (1.02 mg/l and 2.65 mg/l respectively), potentially indicating a more oxygenating water environment associated with the closest inland monitoring points that would be subject to shallower water depths during the tidal cycle than other monitoring points, or may be indicative of an additional Nitrate load component from an alternative source.
4.4.5 To explore whether average concentrations recorded in the vicinity of La Collette are broadly similar to concentrations within the wider water environment (or may be subject to a wider baseline influence), comparison was made to monitoring results recorded for the 2009 eutrophication study undertaken by Environmental Protection and TTS Departments. Overall the 2011 results for La Collette (0.26 mg/l – 2.21 mg/l Ammonia) were observed to be within the range recorded for sea water in 2009 (0.002 mg/l – 4.35 mg/l Ammonia), but average concentrations recorded at La Collette (0.76 mg/l Ammonia) were 1-2 orders of magnitude higher than those recorded during the Eutrophication study (0.03 mg/l). However the 2009 survey did not include monitoring points close to the La Collette headland area, and with two years of elapsed time between data set collection comparison of such datasets should be treated with caution.
4.4.6 To enable an improved understanding of the contributing influence of La Collette headland to Ammonium and Nitrate loading within the wider water environment (including the influences of other activities within St. Helier ), regular water quality monitoring of the wider water environment by other parties is needed.
Waste Springs
- In contrast to groundwater concentrations recorded within the boreholes (sampling a very localized area), average concentrations recorded for springs issuing from the inert waste were generally an order of magnitude less than those of groundwater. In the case of Ammonium average concentrations recorded for LAG1, LAG4 and LAG5 were a similar order of magnitude to those recorded at SW1 baseline monitoring point. LAG2 and LAG3 recorded average concentrations (1.07 mg/l and 2.63 mg/l respectively) higher than natural baseline. Average Nitrate concentrations recorded for LAG1 and LAG2 were similar to natural baseline, approximately 2-3 times baseline for LAG3 and LAG4, but much higher at LAG5 (1.18 mg/l) similar to levels recorded within the deeper boreholes.
Groundwater
- With respect to groundwater, boreholes BH1 and BH7 record higher average concentrations of Ammonium (25.18 mg/l and 24.89 mg/l respectively) than was recorded in the eastern boreholes screened within the inert waste (1.07 mg/l – 9.86 mg/l). Within boreholes screened in the deeper natural / waste deposits, average Ammonium concentrations of 4.19 mg/l (BH2d) and 18.99 mg/l (BH3d) were recorded. Average Ammonium concentrations for each borehole were observed to be greater than the average local natural baseline concentration recorded at SW1.
- Average Nitrate concentrations with boreholes BH1 and BH7 were low (0.24 – 0.30 mg/l) and comparable to the average local natural baseline concentration recorded in SW1, potentially suggesting little to no additional Nitrate load from this area of the site. In the eastern boreholes average concentrations within the inert waste were a similar order of magnitude to the west (0.23 – 0.91 mg/l), but higher than SW1 average concentrations suggesting only a small additional contribution of Nitrate in the east generally supporting the concept of a reducing environment that is non-conducive to extensive breakdown of Ammonium. In the case of the deeper boreholes (BH2d and BH3d) average Nitrate concentrations were higher than those within the inert waste (1.14 – 2.10 mg/l), potentially indicative of a wider influence or less dilution potential within the deeper channel deposits.
Ash Cells
- Within the ash cells a wide range of average Ammonium concentrations (0.27 mg/l – 294 mg/l) was recorded during the baseline monitoring period. Varying between individual cells, there does not appear to be a correlation between the age of the ash and the concentration of Ammonium recorded. Some of the highest average concentrations recorded were in: Cell 6 (281 mg/l, 13 – 14 year old ash); Cell 22 (294 mg/l, 7 – 8 year old ash); Cell25 (166 mg/l, 5 – 6 year old ash); Cell 26 (172 mg/l, 3 – 4 year old ash); Cell 28 (146 mg/l, <1 year old ash); Cell 29 (111 mg/l, 1 – 2 year old ash); and Cell 31 (101 mg/l, 1 – 2 year old ash).
- In terms of average Nitrate concentrations within the ash cells these range from 0.24 mg/l –
12.45 mg/l, with the majority of cells recording average concentrations of less than 0.7 mg/l. The low concentrations of Nitrate, compared to high concentrations of Ammonium, are indicative of an environment that is non-conducive to the breakdown of Ammonium to Nitrate (consistent with the marginally alkaline and reducing environment within the cells indicated by in-situ pH and EC readings).
Discussion
- Overall when comparing average recorded concentrations for Ammonium and Nitrate between the ash cells, groundwater, waste springs and surface water beyond the sea wall it can be seen that there is a reduction in concentration of several orders of magnitude. However the proportion of Nitrate to Ammonium, combined with in-situ monitoring of pH and redox, suggest that the water environment within the site is generally reducing becoming marginally oxidizing beyond the sea wall. Not conducive to the oxidation and breakdown of Ammonium, such decline in determinand concentrations is therefore considered likely to be due predominantly due to dilution (by a factor of 10 – 20 times) through the constant movement of tidal waters in and out of the site, with a component of potential contaminant retardation through a sorption mechanism.
- In the case of high average concentrations of Ammonium recorded within the western boreholes and at spring monitoring point LAG3 may potentially suggest a contributing source other than the ash cells (possibly the green composting area or previous bulky waste storage within Cell 34). The green composting area was observed to be well concreted with tight control of surface water run-off (through a concrete lined lagoon system and then discharge to foul sewer), and the bulky waste previously stored in unlined Cell34 is in the process of being removed.
- With a decreased amount of tidal flux / general groundwater low point in this area the amount of dilution that can take place to flush out / reduce concentrations over time is restricted, leading to an area of groundwater that will become stagnant with Ammonium / Nitrate over time. Concentrations in surface water beyond this area were not, however, observed to be significantly different from the local natural baseline. With removal of potential sources, a gradual improvement in Ammonium concentrations below the site may be seen during operational monitoring, but an increase in concentrations above baseline in surface water beyond the western inert waste face is not expected.
PHOSPHATE
- With no water quality standard available for Phosphate, comparison is madeto average concentrations recorded at local natural baseline monitoring point SW1 (<0.05 mg/l).
- Beyond the sea wall, average surface water concentrations for monitoring points SW2 – SW12 (and the EfW outfall) were <0.05 mg/l (the same as SW1). Average concentrations recorded at SW14, SW18 and SW20 were marginally above baseline at 0.09 mg/l. At the north eastern corner of the site an average concentration at SW22 of 0.17 mg/l was recorded.
- Average concentrations lower than groundwater were recorded within springs issuing from the inert waste. LAG1 recorded <0.05 mg/l (the same as baseline). Monitoring points LAG2, LAG4 and LAG5 recorded higher than baseline average concentrations of 0.12 mg/l to 0.18 mg/l Phosphate. LAG3 recorded the highest average concentration of 0.77 mg/l.
- Within groundwater average Phosphate concentrations recorded above baseline within inert waste boreholes ranged from 0.19 mg/l to 1.03 mg/l in the eastern boreholes, with 1.64 mg/l recorded in the western boreholes. Boreholes screened within deep waste / natural deposits recorded an average concentration of 0.55 mg/l.
- Ash cell average concentrations vary between individual cells ranging from 0.1 – 2.26 mg/l in Northern Mound cells, to <0.05 mg/l to 2.18 mg/l in southern ash cells.
- Again when comparing average recorded concentrations for Phosphate between the ash cells, groundwater, waste springs and surface water beyond the sea wall it can be seen that there is a reduction in concentration of 1 - 2 orders of magnitude predominantly attributable to dilution.
- PHENOLS
- In groundwater, water issuing from the inert waste springs and surface water beyond the sea wall, Phenol concentrations were all below the water quality standard (with many below detection limit).
- Comparing to a water quality standard of 30 µg/l, the majority of ash cells recorded concentrations around or below the standard. Those significantly higher than the standard recorded concentrations (Cells 24, 25, 26, 27, 31 and 32) within the range observed within the earlier WRc leaching work (100 – 5,300 µg/l). Cell 22 recorded a much higher concentration of 10,800 µg/l.
- TOTAL PETROLEUM HYDROCARBONS
- With respect to Benzene, Toluene, Ethylbenzene and Xylene, all recorded concentrations were observed to be below Environmental Quality Standards in all ash cells, groundwater boreholes, inert waste springs, and surface water monitoring points beyond the sea wall.
- The sum total of aliphatic and aromatic hydrocarbon concentrations were compared to the Dutch Groundwater Intervention Standard for Mineral Oils (2009) of 600 µg/l for contrast. With respect to the ash cells, the majority of recorded concentrations were found to be below the standard (with the exception of Cell 28 where a maximum concentration marginally above standard of 697 µg/l was recorded).
- Average groundwater concentrations recorded (Figure 15) were significantly lower than the Dutch intervention standard. Maximum total concentrations were generally below standard, except in BH7 (932 µg/l). Other elevated maximum concentrations close to the water quality standard were generally associated in the northern part of the southern working area, to the west of East Pit (BH5 maximum 591 µg/l, BH4 maximum 489 µg/l, and BH6 maximum 423 µg/l). Such concentrations are confined to boreholes screened within the waste, with boreholes screened within underlying natural deposits recording concentrations generally below detection. Generally higher than concentrations recorded within the ash cells, this may potentially be residual concentrations associated with legacy activities (e.g. historic remediated fuel spill area).
- In the case of waste springs and surface water beyond the sea wall, total concentrations of TPH were generally found to be below detection limits.
- POLYAROMATIC HYDROCARBONS (PAHS)
- Recorded concentrations (both average and maxima) of Napthalene in ash cells (0.1 – 2.08 µg/l), groundwater (0.02 – 0.64 µg/l), waste springs (0.1 – 0.2 µg/l) and surface water beyond the sea wall (0.1 – 0.25 µg/l) were consistently observed to be less than theWater Quality Standard of 5 µg/l.
- Anthracene and Benzo(a)pyrene are the only other speciated PAHs for which there are Environmental Quality Standards to compare to (0.02 µg/l and 0.03 µg/l respectively).
- Beyond the sea wall, surface water concentrations (both average and maxima) for Anthracene and Benzo(a)pyrene were consistently belowEQS (Figure 16).
- In the case of the waste springs, recorded concentrations of Anthracene were below EQS (with the exception of a maximum concentration (0.04 µg/l) marginally in excess of standard noted in LAG3). Average Benzo(a)pyrene concentrations were generally below standard (except for LAG3 where average concentration was marginally above EQS).
- Recorded groundwater concentrations for Anthracene and Benzo(a)pyrene were generally higher than those recorded within the ash cells, with some boreholes recording higher concentrations than others (as tabulated below and discussed in subsequent paragraphs).
Table 4.5: Anthracene and Benzo(a)pyrene concentrations in groundwater
Borehole No. | Screened Material | Anthracene (µg/l) | Benzo(a)pyrene (µg/l) | ||||
|
| Min | Average | Max | Min | Average | Max |
BH1 | inert waste over granite | 0.02 | 0.07 | 0.15 | 0.02 | 0.58 | 1.14 |
BH2d | channel fill / granite | 0.01 | 0.02 | 0.02 | 0.01 | 0.02 | 0.04 |
BH3s | inert waste | 0.02 | 0.02 | 0.02 | 0.01 | 0.10 | 0.19 |
BH3d | inert waste / channel fill | 0.02 | 0.04 | 0.10 | 0.01 | 0.26 | 0.68 |
BH4s | inert waste | 0.12 | 0.58 | 1.81 | 0.20 | 1.87 | 6.37 |
BH5 | inert waste | 0.02 | 0.08 | 0.21 | 0.01 | 1.34 | 3.10 |
BH6(20) | inert waste / channel fill | 0.02 | 0.02 | 0.02 | 0.01 | 0.03 | 0.06 |
BH6(50) | inert waste | 0.73 | 0.73 | 0.73 | 10.60 | 10.60 | 10.60 |
BH7 | inert waste | 0.02 | 0.02 | 0.02 | 0.01 | 0.06 | 0.13 |
XX = above Water Quality Standard.
- With the exception of boreholes BH4s and BH6(50), Anthracene concentrations were generally only slightlyabove EQS. More widespread exceedences in Benzo(a)pyrene were noted, with significant exceedences of EQS recorded in boreholes BH4s, BH5 and BH6(50). Higher concentrations may potentially be associated with historic activities, such as bulky waste storage within unlined Cell 34 or a residual legacy associated with the remediated fuel spill area to the west of East Pit.
- With respect to the ash cells, average and maxima concentrations of Anthracene were generally found to be only marginally above standard with the exception of maxima concentrations recorded in Cell 16 (0.16 µg/l), Cell 22 (0.15 µg/l) and Cell 31 (0.21 µg/l). In the case of Benzo(a)pyrene maxima concentrations marginally exceeded standard in Cells 6, 25, 27, 28, 29, 31 and 32. Only the maximum concentration of Benzo(a)pyreneinCell16 (0.39 µg/l) significantly exceeded the water quality standard.
- When comparing the sum of Benzo(b)Fluoranthene, Benzo(k)Fluoranthene, Benzo(ghi)perylene, and Indeno(1,2,3-cd)pyrene tothe combined Drinking Water Standard (0.1 µg/l), a similar pattern of exceedences is noted (Figure 17). Ash cells generally record cconcentrations below the standard, with those above standard (Cells 16, 25, 26, 27, 28, 29, 31 and 32) recording concentrations much lower than underlying groundwater. Significant exceedences in groundwater are noted in boreholes screened predominantly in the waste of BH1, BH4s, BH5s and BH6(50) with the highest concentration recorded in BH6(50) of 31.17 µg/l. Waste spring concentrations were at or marginally higher than Drinking Water Standard. Beyond the sea wall surface water concentrations were less than the standard, generally below detection limits.
 Summary of key points:
- Being the furthest surface water monitoring point from waste deposits or other headland activities, SW1 potentially represents a local natural baseline location. Baseline seawater is characterised by high electrical conductivity (52,000 – 54,000 µS/cm), Fe concentrations (34 mg/l) in exceedence of EQS and elevated Ammonium (0.74 mg/l) and Nitrate (0.26 mg/l).
- Beyond the armour wall sea water is characterised by near neutral to slightly alkaline, marginally reducing / oxidising conditions. Heavy metal concentrations were generally observed to be lower than EQS (with the exception of Fe, and marginal exceedence of Cu at isolated monitoring points). All organic determinands (Phenols, TPH and PAHs) were recorded at concentrations less than water quality standards or detection limits.
- Waste spring water quality for in-situ parameters, heavy metals and organics were generally found to be less than groundwater, more similar to sea water concentrations recorded at surface water monitoring points beyond the armour wall. Slightly higher heavy metal concentrations were noted at monitoring point LAG3.
- In groundwater, differing water quality signatures were noted within the western and eastern boreholes (reflective of differing potential sources in combination with contrasting groundwater environments).
- Western boreholes
- neutral to slightly acidic, marginally reducing, groundwater with lower EC than sea water.
- Some exceedence of EQS noted for As, Cd, Cr, Mn and Fe.
- Ammonium concentrations much higher than in the east, with Nitrate reflecting baseline conditions, potentially suggesting an additional Ammonium input in this area (e.g. from green composting area or historic bulky waste storage) in combination with reduced tidal flux / dilution potential.
- Organic determinands below standards.
- Eastern boreholes
- neutral to slightly alkaline, reducing, groundwater with similar EC to sea water.
- Some exceedence of EQS noted for Cu, Mn and Fe.
- Ammonium concentrations exceed EQS, with Nitrate concentrations indicating little degradation of Ammonium (reflecting the predominantly reducing conditions).
- Phenol and BTEX concentrations below EQS.
- TPH concentrations below (but close) to Dutch standard in northern part of southern working area (potentially a residual influence of the historic fuel spill area).
- Anthracene and Benzo(a)pyrene concentrations in northern part of southern working area higher than ash cells, and above EQS, potentially associated with historic activities.
- Ash cells water quality varies significantly between cells (suggesting hydraulic disconnection), generally at the low end of the range of concentrations reported in WRCs 2003 / 2007 leaching studies, with little evidence of ageing trend. Widespread exceedence of EQS for As, Cu and Ni (with occasional Cr, Mn and Fe exceedence). Phenol and BTEX concentrations are generally at or below water quality standards. Anthracene and Benzo(a)pyrene concentrations are marginally above EQS.
- With respect to Ammonium, exceedence of EQS was observed in all monitoring points – predominantly due to the low concentration nature of the EQS itself. Seawater concentrations were found to be within a similar range to those recorded in the 2009 eutrophication survey (not undertaken locally to La Collette), but 2011 averages were 1-2 orders of magnitude greater than the 2009 averages. To ascertain whether or not the wider natural baseline is impacted by elevated Ammonium concentrations, and hence improve understanding of the contributing influence of La Collette, regular water quality monitoring of the wider water environment by other parties is needed.
- Summary
- GENERAL
- Since 1995 the La Collette Waste Management Facility (WMF) has received a mixed waste stream (predominantly inert materials, with less than 10% ash), with deposition commencing in the north (Northern Mound) and gradually working to the south and west. Inert materials[1] have been deposited behind the sea wall up to an elevation between the mean High Water Spring Water Tide (approximately 11 m ACD, one metre higher than maximum groundwater levels recorded at the site) and the top of the sea wall (14 – 15 m ACD).
- Ash residue (predominantly bottom ash) is emplaced in 4 – 5 m deep lined cells (up to 3 levels) above the Mean High Water Spring line. In addition to waste deposition, ancillary activities at the site include green composting, aggregate recycling and the temporary processing of bio-remediated soils and storage of street sweepings on top of lined cells.
- In addition to the above, other key potential contaminative sources (historic and current) that may influence water quality within the wider water environment to the south and east of the WMF include a remediated diesel spill in the northern corner of the southern working area, historic temporarybulky waste storage within unlined pits, and discharge from the JEC Plant / Energy from Waste outfall.
- Baseline water quality monitoring (recording both in-situ parameters and laboratory determinands), in combination with parallel studies focusing on physical data, has been undertaken monthly at 42 locations (18 ash cells, 7 boreholes, 5 springs issuing from inert waste material underlying the ash cells, and 12 low tide seawater locations within the Ramsar beyond the sea wall) between March and August 2011. Laboratory analysis for each sample was for upto 75 chemicals (including heavy metals, nutrients, and organic hydrocarbons), chosen as representative of potential contaminants that maybe associated with historic or current activities at the WMF and surrounding area. This is considered to represent an effective spring / summer data set, sufficient to rationalise future monitoring requirements and to form a baseline for comparison to inform any subsequent impact assessments.
- The purpose of such monitoring has been: to characterise the baseline water environment within the WMF and immediate surrounding area; to improve our conceptual understanding of groundwater movements and interactions with the wider water environment (including the Ramsar designated area) beyond the sea wall; and to establish water quality immediately beyond the WMF sea wall (with an improved understanding of potential influences on water quality). Such information will, in the future, be used to: inform Environmental Impact Assessments; the development of an operational monitoring strategy; and inform Waste Acceptance Criteria if required.
5.1.6 Physical groundwater level monitoring at several locations over several short time periods during 2010 / 2011 has improved our conceptual understanding of the hydrogeological regime associated with the WMF. Little cross movement of groundwater (and hence potential contamination) between Phases 1 and 2 of the La Collette headland is expected, due to a combination of lower permeability consolidated sands in Phase 1 combined with the presence of a high permeability rock armour wall between the two phases acting as a preferential flowpath for tidal ingress and egress (and hence driving flow into and out of Phases 1 and 2).
5.1.7 With respect to the WMF itself, groundwater ingress to and egress from the site is both via the Phase 2 rock armour wall / inert waste, and via natural channels filled with beach deposit material within the underlying diorite / granodiorite bedrock. During mid – high tide an upward hydraulic gradient exists between the natural channels and overlying inert waste, suggesting an upward component of groundwater ingress into the inert waste from the natural deposits. Conversely during mid – low tide there is an element of downward movement from the waste to the natural deposit channels, but movement tends to be under less pressure replicating a drainage response.
5.1.8 Tidal variation within groundwater levels recorded, and the lag time between peak tidal levels and peak groundwater levels, suggest a difference in groundwater behaviour in the west of the site (boreholes BH1, BH2 and BH7) to that in the east of the site (boreholes BH3, BH4 and BH5). To the west little tidal variation is observed (0.25 m), and lag times range from 2 – 6 hours, suggesting limited interaction between the sea and groundwater within the area. Groundwater levels are also consistently lower than those to the east, suggesting that the western area of the site generally marks a groundwater low area. By contrast in the east groundwater movements appear more dynamic (1 – 3 m tidal range, 1½
- 3 hours lag time), suggesting a greater degree of interaction between the sea and groundwater in this area.
5.1.9 Hydraulic gradients (the driving force to groundwater flow) will vary during the tidal cycle with maxima (0.02 into the WMF at high tide, and 0.07 away from the WMF at low tide) only reached for a short time during the tidal cycle. Sea water entry into the site is estimated to take place for 3 – 5 hours, whilst exit time from the site is estimated to take place for 6 – 9 hours of the tidal cycle.
5.1.10 The key receptor of interest is the coastal waters of the adjacent South East Coast of Jersey Ramsar area. A brief review of published literature indicates that generally key Ramsar species are broadly tolerant of significant changes to water quality. Exceptions include:
- Common Eelgrass – sensitive to nutrient changes, principally nitrates and phosphates.
- Maerl & Sweet Cup Coral – sensitive to changes in sediment concentrations.
- Native Oyster – sensitive to changes in some heavy metals during the larval stage (principally Hg, Cu, Cd and Zn), although adult population are generally tolerant of high levels of Cu and Zn.
- The evidence from publically available information would suggest that large populations of the above species are not found adjacent to the La Collette headland. However they will still remain a consideration within any future impact assessments.
- Currently accepted water quality standards tend to be more conservative than the limited published research on tolerable water quality concentrations for key indigenous species would suggest. As such the standards have been used for guidance only, with comparisonmade to a local natural baseline sea water monitoring point for context. Being located at the furthest distance from waste activities and other activities associated with the La Collette headland, SW1 was considered to represent a local natural baseline monitoring point to compare to. Conservative screening of water quality monitoring data against coastal water quality standards (predominantly UK Environmental Quality Standards (EQS), marine) was therefore considered appropriate.
- RECEPTOR BASELINE WATER QUALITY
- Beyond the sea wall baseline water quality contained no significant concentrations of organic contaminants (Phenols, Total Petroleum Hydrocarbons (TPH), and Polyaromatic Hydrocarbons (PAHs)), nitrates, phosphates or the majority of heavy metals. Copper marginally exceeds water quality standards at two isolated seawater monitoring locations (of the 12 locations sampled), although the reason for this marginal local effect is unknown it is not regarded as a matter of concern for the sensitive receptors.
- With respect to Iron, widespread baseline exceedence of the water quality standard is noted, including at monitoring locations considered to be natural (SW1). Such elevated concentrations may potentially reflect a natural influence from the diorite /granodiorite bedrock geology, but without comparison to water quality monitoring results for the wider water environment (which is beyond the remit of Transport and Technical Services) to the east of La Collette it is not possible to confirm this as part of this study.
- Ammonium was found to exceed Environmental Quality Standard (due to the low concentration nature of the standard itself) at all monitoring points. Seawater concentrations were found to be in a similar range to those recorded during the 2009 eutrophication survey (although this survey did not include areas local to the La Collette headland), but 2011 averages were one to two orders of magnitude greater than the 2009 averages. To ascertain whether or not the wider natural baseline is impacted by elevated Ammonium concentrations, in combination with a small diffuse contribution from the WMF, quality monitoring for the wider water environment to the east of La Collette would be needed (which is beyond the remit of Transport and Technical Services).
- Groundwater within the inert waste of the WMF does not have anamenity or water supply use. As such it is not considered to be a key receptor, with monitoring focused on its ability to act as a pathway for chemicals to the wider water environment (see below).
- PATHWAY BASELINE WATER QUALITY
- With respect to the springs issuing from the inert waste (representative of a more generic water quality from the inert waste body), baseline water quality was observed to be of a better quality than that recorded in groundwater monitoring wells (restricted local sampling area) and in most cases was found tobe similar to concentrations recorded in seawater samples.
- In the case of groundwater, differing water quality signatures are noted within the western and eastern boreholes reflecting a combination of differing potential contaminative sources within contrasting groundwater dynamic settings (as discussed in paragraph 5.1.8).
- To the west groundwater results noted heavy metal exceedences (As, Cd, Cr, Mn and Fe), Ammonium concentrations that were significantly higher than natural baseline and higher than those recorded in eastern boreholes. Potential sources for additional Ammonium input in this area include green waste composting activities and / or historic bulky waste storage within nearby unlined pits. With a reduced tidal flux / dilution potential in this area, combined with pH and redox conditions that are not conducive to degradation, decline in Ammonium concentrations over time is likely to be slow although it is not anticipated that concentrations will increase.
- To the east heavy metal exceedence in groundwater is restricted to Cu, Mn and Fe. Concentrations tend to be lower than those recorded within ash cell leachate, and as such may be reflective of occasional metal fixtures / fittings within the inert waste when it was originally deposited in combination with a high natural baseline for Fe. Ammonium concentrations exceed EQS, with Nitrate concentrations indicating little degradation of Ammonium (reflecting the predominantly reducing redox conditions).
- With respect to organic contaminants, Phenol, Napthalene and BTEX concentrations within eastern boreholes were consistently found to be below EQS. Confined to the northern part of the southern working area, TPH concentrations were close to (but below) the Dutch Intervention Standard for Mineral Oil reflecting a potential residual water quality influence from the historic fuel spill area. Anthracene and Benzo(a)pyrene concentrations in this area were above baseline, but not of a significant enough concentration to trigger the need for further risk assessment / remediation. Concentrations of Anthracene and Benzo(a)pyrene were higher than those recorded within ash cell leachate, suggesting any source is associated with historic activities (e.g. fuel spill or historic bulky waste storage in nearby unlined pits).
- The near neutral – slightly alkaline pH environment, combined with generally reducing conditions (only marginally oxidising once water reaches the open sea beyond the sea wall) are not conducive to significant degradation chemical reactions. As such, reduction in contaminant concentrations observed between groundwater and the sea is predominantly due to dilution associated with the twice daily flushing of sea water through the site. Within open sea, a short distance beyond the sea wall, conditions would be expected to become oxidising promoting oxidation and further reduction in recorded concentrations.
- ASH CELL BASELINE WATER QUALITY
- Ash cell waters are generally neutral to marginally alkaline in pH, and reducing interms of redox conditions, with some cells recording strongly alkaline and reducing conditions. Such conditions are not conducive to significant chemical degradation reactions.
- Water quality between individual cells is highly variable, with no obvious trends (from a review of monitoring data collected to date) associated with the age of the ash. This may be more reflective of variations in the composition of the waste initially burnt masking any obvious trends in ash degradation over time.
- Widespread exceedence of EQS is noted for As, Cu and Ni, with only occasional cells recording exceedences for Cr, Mn and Fe. A wide range of Ammonium concentrations (varying over several orders of magnitude) were recorded, all in excess of the low EQS.
- With respect to organic contaminants, Phenol, Napthalene and BTEX are generally recorded at or below EQS. Anthracene and Benzo(a)pyrene concentrations are only marginally above EQS.
- Overall ash cell contaminant levels were observed to be at the low end of the range of concentrations reported in WRCs 2003 / 2007 leaching studies. Heavy metal concentrations were found to be similar in scale to that which maybe associated with an urban run-off.
- CONCLUSIONS
- The six month baseline water quality monitoring survey, plus groundwater level monitoring, has considerably improved our understanding of the hydrogeological and water quality regime of the La Collette WMF (and immediate surrounding area).
- Water quality in the sea surrounding the site was found to be generally of a quality that would not be of concern for the sensitive receptors that maybe located in the area. The near neutral – slightly alkaline pH environment, combined with generally reducing redox conditions (only marginally oxidising once water reaches the open sea beyond the sea wall) are not conducive to significant degradation chemical reactions. As such, any reduction in contaminant concentrations through the source-pathway-receptor linkage is due to physical mechanisms – predominantly dilution.
- The high variation in water quality within the ash cells (suggesting hydraulic disconnection), in combination with a basic water balance assessment suggests hydraulic containment is generally performing within climatic expectations, and lack of some key contaminants in groundwater would suggest that the ash cells are effective in containment of the low level contaminants in the cell water.
- Monitoring results for groundwater samples suggest some localised legacy influence of historic (e.g. fuel spill or bulky waste storage) or ongoing operations (e.g. green composting) on water quality (as discussed above). However the water quality of the waste springs and seawater beyond indicates that such legacy influences are not having a significant impact on receptor water quality.
- It is acknowledged that this current monitoring dataset represents a spring / summer baseline, and as such will be supplemented with additional data during operational monitoring (proposed to be undertaken quarterly and focused on key monitoring locations / determinands). In combination with any wider water environment monitoring undertaken by parties other than Transport and Technical Services, such information will, in the future, enable further improvements to the understanding of La Collettes contribution to the wider water environment (including the Ramsar designated area to the south and east of the WMF).
- References
Capita Symonds Ltd (Sept 2010a): La Collette Water Quality Monitoring Strategy. Stage 1: Contextual Factual Report. For discussion at 30 September 2010 meeting. Report to States of Jersey Transport and Technical Services Department.
Capita Symonds Ltd (Sept 2010b): EfW Residue High Level Review. Report to States of Jersey Transport and Technical Services Department.
Capita Symonds Ltd (May 2011): La Collette Waste Management Facility and Surrounding Area. Water Quality: Source Analysis Review. Draft for TTS Review. Report to States of Jersey Transport and Technical Services Department.
Capita Symonds Ltd (November 2011a): La Collette Waste Management Facility. Ash Cells: Hydrogeological Conceptualisation. Draft for TTS Review. Report to States of Jersey Transport and Technical Services Department.
Capita Symonds Ltd (November 2011b): La Collette Waste Management Facility. Hydrogeological Risk Assessment in Support of Cell 34 Design. Report to States of Jersey Transport and Technical Services Department.
Jackson , E.L. (2003): Importance of seagrass beds as a habitat for fishery species around Jersey. Thesis submitted to the University of Plymouth.
Plymouth Marine Laboratory (2009): Review of the current ecological status of the South East Coast Jersey Ramsar site.
Robinson, H.D., Knox, K., and Bone, B.D (Sept 2004): Improved definition of leachate source term from landfills. Phase 1: review of data from European landfills. Environment Agency Science Report P1-494/SR1.
WRc plc (Dec 2003): Jersey Bottom Ash Characterisation 2003: Full Characterisation. Final Report. Report to Jersey Public Services Department. Ref: UC6591.
WRc plc (Nov 2007): Jersey Reclaimed Ash Characterisation Study 2007: Draft Report. Report to Jersey Transport and Technical Services. Ref: UC7584.
Appendix A Figures
Appendix B Potential Contaminant Sources Associated with La Collette Headland
Table B.1: Potential contaminant sources within the wider La Collette development area that may influence baseline water quality
(derived from Capita Symonds Source Analysis Review, May 2011).
Potential Source | Location / Area | Summary Notes | Potential to influence baseline water quality within or to the east of La Collette WMF |
Below water fill material | JEC Power Plant | Deposited prior to 1965, nature of fill is unknown. | Low to Negligible- Given that deposition was over 40 years ago, and there will have been a significant through-flow of water since that time, it is considered unlikely that the fill material is contributing significant concentrations of contaminants. |
Phase 1 | The fuel consortium area is founded on consolidated dredged sand. Such virgin material is considered unlikely to be a significant source of contamination. The remainder of Phase 1 land is described as having been reclaimed using general construction fill of unknown origin. | Low - The location of the Phase 1 rock armour wall, combined with the consolidated dredged sand, (conceptualised as a high permeability pathway for groundwater to flow west), would suggest that potentially the movement of groundwater between Phases 1 and 2 is likely to be minimal. | |
Phase 2 | Inert fill material comprising construction and demolition waste (including gypsum plasterboard). Deposition has incorporated two levels of careful visual inspection (at weighbridge and tip head) prior to emplacement. Any materials that were suspected of failing the sites Waste Acceptance Criteria[1] (WAC) were stored in skips, or within lined ash pits. | Low - Moderate – given the ingress and egress of tidal waters through the fill, combined with acceptance procedures, the likelihood of significant influence is likely to be low. However the potential for rogue materials cannot be completely ruled out, and as such the potential to influence water quality is adjusted to Low – Moderate. | |
Above water fill material | Phase 1 | Comprises consolidated dredged sands and general construction fill of unknown origin with respect to Phase 1. | Low - The nature of the fill materials, combined with the presence of the high permeability rock armour wall acting as a preferentially pathway, means that material is unlikely to have a significant influence on quality within Phase 2. |
Phase 2 | Connex bus depot and the new Energy from Waste plant are founded on general construction fill of unknown origin. | Bus Depot / EfW plant - Low - Moderate - material at Bus Depot observed to be consolidated at time of site investigation. Fill materials would not be expected to generate significant concentrations of contaminants, however the potential for rogue materials cannot be completely ruled out, and as such the potential to influence water quality is adjusted to Low – Moderate. |
Potential Source | Location / Area | Summary Notes | Potential to influence baseline water quality within or to the east of La Collette WMF |
Above water fill material (continued) | Phase 2 (continued) | Former aggregate working area - area of ground associated with a diesel spillage by the operator at that time was remediated16, being lined with Terram and backfilled with clean fill. Generally less than 1,000 mg/kg of TPH in soil remained, with some areas up to 2,000 mg/kg. Ash pits of the Northern Mound and the historic and ongoing disposal of ash at the La Collette WMF - deposited in 4 -5 m deep, lined cells (with basal drainage layers for leachate collection and capping installed after cell filling has been completed), the ash deposited generates a leachate potentially high in heavy metals, ammonia and PAHs. Two buried bulky waste pits (to the west of Ash Pits 26 and 28), and in open East Pit, that may have undergone some decomposition. Deposition within the East Pit has only been since the autumn of 2010, whilst the buried bulky waste cells to the west of Ash Cell 26 and 28 are thought to have been present for several years. | Former Aggregate Working Area – Moderate. Although cleaned up to agreed limits, the remaining TPH in soils above water will potentially have some residual diesel hydrocarbon signature on water quality. Ash Pits – Moderate – High. If engineering measures failed, potential leachate quality within the ash pits has a moderate to high risk of influencing baseline water quality within the WMF. Temporary Bulky Waste Pits – Moderate – High. Relatively unknown material deposited, in unlined pits that may have undergone some decomposition. Given the un-quantified nature of these pits, a moderate to high risk of influencing baseline water quality within the WMF has been assigned. |
Discharge Consents | Phase 1 | North of Phase 1: Two abstraction / discharge points –Viviers (sea water for use in fish holding bays), and Victoria Pier for the JEC power plant (cooling waters discharge monitored for temperature and biocide). West of Phase 1: two discharge points – Sunseeker Boatyard, and drainage outfall at the tanker berth jetty head. Both have potential to contribute silt, hydrocarbons and other trace contaminants. | Low -. Given the immediate dilution from mixing with sea water, combined with the harbour currents within St. Aubins Bay, it is unlikely the Phase 1 discharges will significantly influence water quality to east of WMF. |
Phase 2 | JEC Power Plant – cooling waters discharge, required to monitor got temperature, amines and halogens. Energy from Waste Plant – clean waters discharge, required to monitor for temperature and oil (5 mg/l limit). | JEC waters - Low. Power plant is generally non-operational for the majority of time. EfW plant – Low to Moderate. Clean waters discharge, but potential for oil and silt if drainage interceptors fail. |
16 through excavation and disposal of any soils with TPH greater than 2,500 mg/kg limit agreed with the Environmental Protection department
Potential Source | Location / Area | Summary Notes | Potential to influence baseline water quality within or to the east of La Collette WMF |
Soakaways | La Collette development area | Soakaways have the potential to act as pollution pathways either through the direct introduction of contaminants (e.g. fuel spills, contaminated run-off) or through enhanced infiltration through potentially contaminated material. Across the La Collette development area there are several soakaway locations (located either within general construction fill of unknown origin areas or on rock armour walls. | Low - soakaways, receive run-off from areas of hardstanding or roads that may potentially contain low concentrations of contaminants (generally silt or hydrocarbons). In addition drainage will pass through standard oil interceptors or silt traps further reducing the potential influence on baseline water quality |
Fuel Storage and Transport | JEC Power Plant | Above ground heavy fuel oil and gas oil tanks - presumed to have been placed in concreted areas, and to be double skinned, these tanks do not appear to be contained within bunds. Although the power plant is not in operation continuously, it is proposed that the fuel tanks will continue to be used for storage to supply the new Energy from Waste plant and as such will continue to represent a potential source of contamination. | Low. Any leakage would be likely to enter the power plants drainage system, with hard standing run-off passing via oil interceptor to the buried culvert to the south ultimately discharging to the Havre des Pas bay area. |
Phase 1 | Rubis / Esso gas and fuel consortium area - above ground fuel | Low – Although the potential exists for fuel leaks to enter the water environment, principally via the Phase 1 rock armour wall and the soakaway in the Connex bus depot, the presence of the high permeability rock armour wall would suggest minimal groundwater movement between Phases 1 and 2. As such the potential to influence water quality to the east of Phase 2 is considered to be low. | |
tanks and above ground gas / oil pipelines running from the tanker berth to the site. Located on tarmaced / concreted areas the fuel tanks are located within bunded areas, presumed to be suitably designed for full containment in the event of tank rupture. Assumed that all tanks are of an appropriate double skin design capturing any leakage should rupture within the inner skin occur. Hard standing run-off is collected via the site drainage system and discharged, via oil interceptor, to the soakaway within the Connex bus depot. Waste oil and diesel additive residues are assumed to be tankered off-site for disposal. It is not thought that there are any concrete structures / gullies below the above ground pipelines to capture fuel in event of pipe leakage. Given the potential volumes that might be leaked or the location of the pipelines, it is assumed that any leakage would be noticed quickly and dealt with appropriately to minimise the risk of contamination to the environment. |
Table B.2: Potential contaminant sources within the La Collette Waste Management Facility area that may influence baseline water quality
(derived from Capita Symonds Source Analysis Review, May 2011).
Potential Source | Location / Area | Summary Notes | Potential to influence baseline water quality within or to the east of La Collette WMF |
Green Composting Operations | Green Composting Area | Drainage from the compost stockpiles is likely to be characterised by contaminants such as ammonia, nitrate, and possibly any bacterial agents[2] that have been added to the composting process to enhance degradation. The composting area is concreted with drainage from stockpiles entering a dedicated concrete lagoon. Lagoon waters are re- circulated, via spraying of the compost heaps, before being pumped to a concrete gully prior to being pumped to foul sewer. Run-off from the concreted green waste reception area, potentially containing hydrocarbons and silt, is gathered in drainage gullies prior to disposal to foul sewer. | Low – Moderate. Processing areas are concreted, with re-circulated waters and reception area run-off disposed to foul sewer. Potential for infiltration if concreted areas become damaged significantly, hence adjustment to moderate. |
Temporary Bulky Waste Storage | East Pit & two buried pits to west of Ash Pits 26 / 28 | Prior to lining, pits may temporarily be used for the storage of some materials before the waste is sent to the Bellozane incinerator. Such waste may be materials that are too big to go through the incinerator without shredding, or potentially putrescible. The variety of potential material stored could be characterised by a wide range of contaminants. | Moderate – High. Given the unlined nature of the pits, the potential exists for such material to have a component of influence on baseline water quality within the underlying inert fill in the short. |
Ash disposal | Ash Pits | Encapsulated waste from the Bellozane Incinerator (comprising bottom ash, fly ash and metal inclusions in bottom ash) has been deposited (both historically and currently) in a layered sequence of 4- 5m deep pits. Each cell is lined, a basal drainage layer installed, and ultimately capped prior to commencement of construction of the next ash cell. Whilst uncapped the lined pits are pumped and leachate tankered to Bellozane sewage treatment works for disposal. Leachate generated within the ash tends to be characterised by elevated levels of heavy metals, pH and in some cases ammonia. PAHs and mineral oils may be present where ash has not been fully combusted. | Moderate – High. If engineering measures failed, potential leachate quality within the ash pits has a moderate to high risk of influencing baseline water quality within the WMF. |
Potential Source | Location / Area | Summary Notes | Potential to influence baseline water quality within or to the east of La Collette WMF |
Road Sweepings & Contaminated Soils Temporary Storage | Various open lined ash pits | Soils that do not meet the inert Waste Acceptance Criteria, or street sweepings, are stored on top of open lined ash pits in order to capture any leachate generated. Contaminants may potentially include hydrocarbons, metals, ammonia and nitrates. | Moderate - Any leachate generated is captured within the ash cell leachate. Should ash cell engineering measures fail, then there is potential that this source may contribute to the influence of ash leachate upon the underlying water quality. |
Fuel Storage | Recycled Aggregate Production Area | A A Langlois Haulage Ltd are currently sub-contracted to TTS to operate the recycled aggregate production area. Operations predominantly comprise crushing of general construction and demolition waste, with dry screening of crushed material into required grades of material that can be used as aggregate. The only key potential source of note within this area is in respect of oil storage and accidental spillage. The tank observed on site (November 2010) is double skinned, but located directly on the ground (rather than on concrete, or pallets) as such any leakage (or accidental spillage during re-fuelling) would soak into the underlying inert fill potentially influencing the baseline water quality with respect to hydrocarbons. | Low - Moderate. Double skinned tanks provide some mitigation through capture of fuel if inner tank were to be ruptured, however any rupture of the second skin or accidental spillage would not be mitigated. |
Weighbridge Area / General Site | There is no centralised fuel storage / re-fuelling area for the site. Drums / tanks of oil (fuel, lubricating or heating oil) were noted around the site (November 2010). Some tanks were located at height above ground, but the majority were located on the ground itself or on wooden pallets (rather than on concrete). Storage tanks were double skinned, however the tanks were not contained within bunded areas that would provide a second capture point in the event of failure of both skins. In addition there was no evidence of drip trays below tank taps to trap any accidental spillage or tap leakage. As such there is the potential for hydrocarbons to contribute to baseline water quality. Single oil drums (most empty) were around the site, placed on the ground itself or on wooden pallets. The potential for accidental spillage, or leakage as drums corrode over time, exists. | Low - Moderate. Double skinned tanks provide some mitigation through capture of fuel if inner tank were to be ruptured, however any rupture of the second skin or accidental spillage would not be mitigated. | |
Wheelwash waters and run-off from Weighbridge area | Weighbridge | With respect to the weighbridge offices of the La Collette WMF, located on a concrete area with drainage direct to sewer, there are limited sources that would be likely to provide a contribution to baseline water quality in the local area. The wheel-wash area appears to re-circulate wash waters with minimal settlement, with any over-spill appearing to soak to ground. As such the potential exists for silt and hydrocarbons to soak to ground, albeit concentrations are unlikely to be significant. | Low -. Few sources of concern, combined with concreted areas and re- circulated waters minimises risk of influence to baseline water quality below WMF. |
Appendix C In Situ Water Quality Results
Appendix D Laboratory Analytical Results
Appendix E Extracted Data & Statistics
Appendix F Groundwater Level Hydrographs
Appendix G Ecological Water Quality Literature Review
Literature review of evidence for the sensitivity and/or tolerance of identified protected species to changes in key water quality determinands at La Collette
INTRODUCTION
This appendix comprises a review of published information in order to understand the sensitivity of the South East Coast of Jersey Ramsar Site, which lies adjacent to the La Collette waste management facility, to changes in water quality.
The review focuses on key ecological receptors (protected species) of the Ramsar as general indicators of the sites overall sensitivity. The review identifies whether these species may or may not be vulnerable to key chemicals and, if so, what the acceptable levels of these chemicals are in the short and long term (where known).
REVIEW METHOD
This review identifies the environmental change factors that may potentially interact with the Ramsar site as a result of activities at La Collette, and the key ecological receptors of the Ramsar site. A relative assessment of ecological receptor sensitivity (plus additional information regarding the potential effects of specific changes in the environment) is provided.
The following literature and other resources were consulted during this review:
- South East Coast of Jersey Ramsar site Relevant Information Sheet (RIS) (accessed at http://jncc.defra.gov.uk/pdf/RIS/UK23001.pdf, in August 2011)
- Jerseys South East Coast Ramsar Management Plan, States of Jersey, February 2011.
- Cole, S., Codling, I.D., Parr, W. and Zabel, T. (1999). Guidelines for managing water quality impacts within UK European marine sites. UK Marine SAC Project, WRc Swindon.
- Linley, A., Laffont, K., Kendall, M. and Bates, A. (2009). Review of the current ecological status of the SE Coast Jersey Ramsar Site. 84pp.
- Tyler-Walters, H., Hiscock, K., Lear, D.B. & Jackson , A. (2001). Identifying species and ecosystem sensitivities. Report to the Department for Environment, Food and Rural Affairs from the Marine Life Information Network (MarLIN), Marine Biological Association of the United Kingdom, Plymouth. Contract CW0826.
- http://www.ukmarinesac.org.uk
- http://www.marlin.ac.uk
DETERMINANDS
Our background knowledge on the potential sources of contaminants at the site indicates that the determinands listed below are most relevant in understanding the tolerance of species to potential changes in chemical concentrations.
- Suspended sediment
- Heavy metals
- Hydrocarbons (PAH & TPH)
- Nutrients (e.g. ammonia, nitrate)
ECOLOGICAL RECEPTORS Overview
The site, which is amongst the largest intertidal reef sites in Europe, consists of wave-cut rock platforms that may be exposed at low tides, extensive reef areas, rocky shores, soft substrate gullies and a shallow soft sediment bay. Between them, these areas host various habitat types including: reefs, boulder fields, mud, sand and shingle shores which are exposed at low tide; shallow tidal lagoons; seagrass beds, and; outlying reefs.
The site sits at the convergence of Boreal (cold temperate) and Lusitanian(warm temperate) biogeographical. The result of this and the range of habitats is that the site holds great biodiversity with a diverse range of biotypes and some uncommon species assemblages and some species exist here at the northern and southern periphery of their natural ranges. The development of rich and diverse biological assemblages contribute to the fisheries and biodiversity of the wider Normano- Brecon Gulf[1] and English Channel in which the site sits.
Key Species
As of 2010, around 710 species had been recorded at the site and more are likely to be identified. Noteworthy flora and fauna of the site is given in sections 21 and 22 of the RIS for the site (Table Appendix G-1).
Table Appendix G-1. Noteworthy ecological features as described in the RIS for the South East Jersey Coast Ramsar site.
Flor | Sea grasses: Zostera marina, Zostera noltei |
Ascophyllum nodosum (knotted wrack) colonies | |
Lower plants: Bifurcaria bifurcata, Codium fragile subsp. tomentosoides, Codium tomentosum, Cystoseira baccata, Cystoseira foeniculaceus, Cystoseira nodicaulis, Cystoseira tamariskolia, Halopteris scoparia, a Stilophora tenella, Calliblepharis jubata, Choreocolax polysiphoniae, Falkenbergia rufolansa, Gigartina teedei, Gracilaria bursa-pastoris, Grateloupia filicina var. filicina, Griffithsia corallinoides, Halopithys incurvus, Halurus equisetifolius, Kallymenia reniformis, Lomentaria clavellosa, Mesophyllum lichenoides, Polysiphonia nigrescens. | |
Fa | Hippocampus hippocampus (short snouted seahorse) |
Gobius cobitis (giant goby) | |
u Molluscs: Modiolus modiolus, Ostrea edulis, Haliotis tuberculata, Gibbula pennanti, Mactra glauca, Ocinebrina aciculata, Rissoa guernei | |
Crustaceans: Pisa tetraodon, Thia scutellata |
Additional flora and fauna are identified elsewhere the RIS, and within the Jersey Biodiversity Action Plan or listed within the Conservation of Wildlife (Jersey) Law 2000 (as amended), include:
- Laminaria species (kelp).
- Sargassum muticum (a non-native brown seaweed).
- Ulva lactuca (a green alga).
- Birds (wildfowl and waders) – particularly Brent Goose Branta benicla.
- Ammodytes species (sand eels) and other pelagic fish (including Basking shark Cetorhinus maximus).
- Mammals including whales, dolphins (bottlenose dolphins Tursiops truncatus) and porpoises (all species.) Cetacea*; and seals (all species) Pennipedia*.
- Reptiles – particularly Turtles (all species) Cheloniidae* and Dermochelyidae*
Of all identified species and habitats, a selection has been carried forward for identifying tolerances. This selection (see below) is based largely on the availability of evidence regarding sensitivity to water quality changes, but does cover both flora and fauna and includes species of both international and national importance. Of the above bullet list, only birds, plants and molluscs would be exposed to long-term exposure to adverse changes in water quality, the latter two would generally be covered off through the sensitivity of other molluscs already incorporated into the list and Zostera sp. which are already covered off. Bird species are of importance and will be affected by any decline in food availability within the Ramsar site, ecotoxicological response is unknown.
RELATIVE SENSITIVITY OF ECOLOGICAL RECEPTORS
The sensitivity of a species is an estimate of its intolerance to an environmental change. The Marine Life Information Network (MarLIN) website[1] provides a useful guide to relative sensitivity of various ecological receptors through their biotype sensitive assessments (based on and described by Tyler- Walters et al., 2001). Absolute sensitivity is difficult to assess without site-specific research because the response to a change in a specific environmental factor is influenced by the magnitude, duration, or frequency of that change and the environmental setting. However, by providing standard benchmarks for change, the MarLIN approach allows a relative and qualitative sensitivity to be identified for the purposes of this review.
Selected standard benchmarks used for assessing sensitivity are provided in Table Appendix G-2 below.
Table Appendix G-2. Standard benchmarks for assessing sensitivity (after http://www.marlin.ac.uk, accessed August 2011)
Changes in suspended sediment | An arbitrary short term, acute change in background suspended sediment concentration e.g., a change of 100 mg/l for 1 month. |
Changes in levels of heavy metals | Sensitivity is assessed against the available evidence for the effects of contaminants on the species (or closely related species at low confidence) or community of interest. For example: evidence of mass mortality of a population of the species or community of interest (either short or long term) in response to a contaminant will be ranked as high sensitivity;
evidence of reduced abundance, or extent of a population of the species or community of interest (either short or long term) in response to a contaminant will be ranked as intermediate sensitivity;
evidence of sub-lethal effects or reduced reproductive potential of a population of the species or community of interest will be assessed as low sensitivity. The evidence used is stated in the rationale (see Appendix 1). Where the assessment can be based on a known activity then this is stated. The tolerance to contaminants of species of interest will be included in the rationale when available; together with relevant supporting material. |
Changes in levels of hydrocarbons | |
Changes in levels of nutrients |
Sensitivity is ranked and is a result of intolerance combined with recoverability. Table Appendix G-3, below, summarises the definitions of the MarLIN rankings.
Table Appendix G-3. Sensitivity rankings (after http://www.marlin.ac.uk, accessed August 2011)
Very High | Killed or destroyed - "high" intolerance & is expected to recover only over a prolonged period of time - recoverability is "very low" or "none". Damaged - "intermediate" intolerance & is not expected to recover at all - recoverability is "none". |
| Killed or destroyed - "high" intolerance & and is expected to recover over a very long period of time - "low" recoverability. Damaged - "intermediate" intolerance & is expected to recover over a very long period of time - recoverability is "low", or "very low". Reduced viability - "low" intolerance & is not expected to recover at all - recoverability is "none". |
| Killed or destroyed, "high" intolerance & is expected to take more than 1 year or up to 10 years to recover - "moderate" or "high" recoverability. Damaged - "intermediate" intolerance & is expected to recover over a long period of time - "moderate" recoverability. Reduced viability - "low" intolerance & is expected to recover over a very long period of time - recoverability is "low", "very low". |
| Killed or destroyed, "high" intolerance & is expected to recover rapidly - "very high" recoverability. Damaged - "intermediate" intolerance & is expected to recover rapidly - "very high" or "high" recoverability. Reduced viability - "low" intolerance & is expected to take more than 1 year or up to 10 years to recover - "moderate" or "high" recoverability. |
| Killed or destroyed, "high" intolerance & is expected to recover rapidly i.e. within a week - "immediate" recoverability. Damaged - "intermediate" intolerance & is expected to recover rapidly, i.e. within a week - "immediate" recoverability. Reduced viability - "low" intolerance & is expected to recover within a year - "very high" recoverability. |
Not Sensitive | Reduced viability - "low" intolerance & is expected to recover rapidly, i.e. within a week - "immediate" recoverability. The habitat or species is tolerant of changes in the external factor. |
Not Sensitive * | The habitat or species may benefit from the change in an external factor - intolerance has been assessed as "tolerant" |
Not Relevant | The habitat or species is protected from changes in an external factor (i.e. through a burrowing habit or depth), or is able to avoid the external factor. |
Table Appendix G-4 provides information obtained from the MarLIN website for specific ecological receptors identified within the RIS as being present in the South East Jersey Coast Ramsar site.
Table Appendix G-5 at the end of this appendix outlines in more detail the sensitivity assessment rationale for each environmental change factor (including some known concentration ranges from research work collated by MarLIN).
Table Appendix G-4. MarLIN sensitivity rankings for specific ecological receptors
Ecological Receptor | Sensitivity to Environmental Change Factor | ||||
Sediment | Heavy Metals | Hydrocarbons | Nutrients | ||
** Internatio | Zostera marina (Common eelgrass) | Moderate | Very Low | Very Low | Very High |
Zostera noltii (Dwarf eelgrass) | Low | Very Low | Moderate | Low | |
Laminaria digitata (Oarweed) | Low | Low | Low | Low | |
Hippocampus hippocampus (short snouted seahorse) | Very Low | Insufficient information | Insufficient information | Insufficient information | |
Pomatoschistus microps (Common goby) | Very Low | Moderate | Low | Insufficient information | |
Pomatoschistus minutus (Sand goby) | Not Sensitive | Moderate | Low | Not Sensitive | |
Pholas dactylus (Common paddock) n | Low | Low | Insufficient information | Insufficient information | |
Phymatolithon calcareum (Maerl) | Very High | Insufficient information | Insufficient information | Very Low | |
Ostrea edulis (Native oyster) | Very Low | High | Very Low | Not Sensitive* | |
*** National I | Ascophyllum nodosum (Knotted wrack) | Not Sensitive | Low | Low | Low |
Modiolus modiolus (Horse mussel) | Not Sensitive | Very Low | Very Low | Very Low | |
Gobius cobitis (Giant goby) | Low | Moderate | Low | Low | |
Pachycerianthus multiplicatus (Fireworks anemone) | Not Sensitive | Insufficient information | Insufficient information | Insufficient information | |
Eunicella verrucosa (Pink sea fan) | Very Low | Insufficient information | Insufficient information | Not Sensitive | |
Palinurus elephas (European spiny lobster) mpo | Not Sensitive | Insufficient information | Insufficient information | Insufficient information | |
Atrina fragilis (Fan mussel) | Very Low | Moderate | Insufficient information | Moderate | |
Leptopsammia pruvoti (Sweet cup coral) | High | Insufficient information | Insufficient information | Very Low | |
Not Listed | Urticina feline (Dahlia anemone) | Very low | Insufficient information | Very low | Insufficient information |
Metridium senile (Plumose anemone) | Not Sensitive | Insufficient information | Not Sensitive | Not Sensitive* | |
Amphiura filiformis (brittlestar) | Very low | Low | Moderate | Not Sensitive* | |
Ophiothrix fragilis (Common brittlestar) | Very low | Insufficient information | Moderate | Low | |
Asterias rubens (Common starfish) | Low | Low | Moderate | Low | |
Henricia oculata (Bloody Henry starfish) | Very low | Insufficient information | Insufficient information | Insufficient information | |
Osilinus lineatus (Thick top shell) | Low | Insufficient information | Low | Low | |
Fucus vesiculosus (Bladder wrack) | Not Sensitive | Low | Low | Low | |
Fucus serratus (Toothed or serrated wrack) | Very low | Low | Low | Low | |
** International Importance – listed under one or more of : Berne Convention, EC Habitats Directive, OSPAR Priority List (Convention for the Protection of the Marine Environment of the North-East Atlantic). Individual receptors may also be listed for importance nationally. *** National Importance – in this case relating to the UK BAP and/or Wildlife and Countryside Act 1981.
WATER QUALITY SCREENING CRITERIA
Environmental Quality Standards (EQS) or guidelines may also inform the appraisal of potential water quality impacts on marine life. EQSs and non-statutory guidelines for particular substances of concern are provided within the following EU Directives, Conventions and guidance.
- EU Water Framework Directive (and related Directives) (makes provision for Governments to plan and deliver a better water environment, focusing on ecology).
- EU Shellfish Waters Directive (aims to protect the aquatic habitat of bivalve and gastropod molluscs, which include oysters, mussels, cockles, scallops and clams and sets physical, chemical and microbiological requirements that designated shellfish waters must either comply with or endeavour to improve).
- OSPAR Convention (aims to prevent and eliminate pollution and to protect the maritime area against the adverse effects of human activities.
- CEFAS Action I & II sediment quality levels (non-statutory guidelines used as part of a body of evidence approach for assessment of potential risk to marine life of disposal of dredged spoil to sea).
- Canadian Interim Sediment Quality Guidelines and Probable Effect Levels (recommended for use in Natura 2000 sites as a first approximation in assessing whether organisms are at risk from sediment concentrations of toxic substances).
The value of these EQSs and guideline values is that they draw upon databases of ecotoxicological responses and so represent the summation of knowledge of the concentrations of substances potentially harmful to marine life, including algae, invertebrates, fish and shellfish, marine mammals and birds. The marine EQSs for identified determinands are generally less than the tolerability values referenced by MarLIN (see Table Appendix G-5). Therefore, the screening approach taken above is considered to be appropriately conservative.
The key interest features of the La Collette Ramsar are the diversity of the habitats and associated communities rather than particular individual species, although a number of noteworthy fauna and flora are identified (Zostera sp. is mentioned specifically). Consequently, it may be relevant to use an assessment that covers broader groups of organisms rather than attempt to identify and apply specific substance / species interactions.
As previously noted, other physical and biological factors may be more important as influences on the growth and distributions of particular species so that any reported tolerance level should be placed within the wider context of the environmental conditions for the south east coast of Jersey. However, in the absence of published research upon which to draw information in these areas, the water quality screening approach outlined above represents the most appropriate approach to assessment at this time.
Ecological Receptor | Environmental Change Factor & Sensitivity Details | Sensitivity | |
Zostera marina & noltii (Eelgrasses) | S | Increased sediment availability may result in raised eelgrass beds or smothering of the leaves. Decreased sedimentation is likely to result in erosion and loss of the eelgrass beds. The grazing and digging activity of brent geese and wigeon may increase erosion of intertidal beds during winter months, but in doing so compensate for the sediment deposited during summer months, which may be beneficial to growth of Z. noltii beds (Nacken & Reise, 2000). Probably able to grow through deposited sediment, e.g. Mediterranean Z. noltii is able to grow through 2 cm of substratum in 4 months (Vermaat et al., 1996). Therefore, Z. noltii beds are probably tolerant of annual or temporary changes in siltation and sedimentation rates. Increased sediment erosion or accretion has been associated with loss of seagrass beds in the Australia, the Mediterranean, the Wadden Sea, and USA. Sediment dynamics and hydrodynamics are key factors in seagrass systems (Asmus & Asmus, 2000a; Davison & Hughes, 1998; Holt et al., 1997). Overall, seagrass beds are probably intolerant of any activity that changes the sediment regime where the change is greater than expected due to natural events in magnitude or duration and an intolerance of intermediate has been reported. The slow recovery of Zostera populations since the 1920s - 30s outbreak of wasting disease and the continuing decline of Zostera noltii beds suggests that, once lost, eelgrass beds take considerable time to re- establish. However, evidence from grazing studies suggest that Zostera noltii beds can recover within a year after removal of 63% of plant biomass (Nacken & Reise, 2000). Similarly, Dawes & Guiry (1992) regarded Zostera noltii as ephemeral in nature. However, where a bed is stressed by other factors, recovery may be delayed (Holt et al. 1997; Davison & Hughes 1998). Increased suspended sediment concentrations will also decrease light penetration. | Moderate / Low |
HM | Little information found for Z. noltii– refer to Z. marina: Known to take up heavy metals mainly through its leaves but studies to date have not observed any significant damage. However, mercury, nickel and lead together with a number of organic substances were found to reduce nitrogen fixation which may affect Zostera viability. Growth of Z. marina is inhibited by 0.32 mg/l Cu and 10 mg/l Hg but Cd, Zn, Cr and Pb had measurable but less toxic effects (Williams et al., 1994). Davison & Hughes (1998) report that Hg, Ni and Pb reduce nitrogen fixation which may affect viability. | Very Low | |
H | Healthy populations can occur in the presence of long term, low level, hydrocarbon effluent (Hiscock, 1987; Davison & Hughes, 1998). Likely to be more vulnerable from direct contact by oil due to its intertidal habitat (Davison & Hughes, 1998; Jones et al., 2000). The Amoco Cadiz oil spill off Roscoff blackened the leaves for 1-2 weeks but had little effect on growth, production or reproduction after the leaves were covered in oil for six hours (Jacobs, 1980). Experimental treatment with crude oil and dispersants halted growth but had little effect on cover. However, pre-mixed oil and dispersant caused rapid death and significant decline in cover (from 55% to 15% within 1 week suggesting that dispersant treatments should be avoided (Holden & Baker, 1980; Howard et al., 1989; Davison & Hughes, 1998). Removal of oil intolerant grazers, e.g. gastropods or amphipods, may result in smothering of eelgrasses by epiphytes or algal. | Very Low / Moderate (Dwarf Eelgrass) | |
N | Increased nutrient concentrations (nitrates and phosphates) implicated in the continued decline of seagrass beds world-wide, either directly or due to eutrophication (Phillips & Menez, 1988; Davison & Hughes, 1998; Philippart, 1994b; Philippart, 1995a, b; Vermaat et al., 1994; Asmus & Asmus, 2000). High nitrate concentrations implicated in decline of Z. marina. Burkholder et al. (1992) - nitrate enrichment caused in poorly flushed areas. Growth and survival were significantly reduced by nutrient enrichment levels of between 3.5 and 35µMolar nitrate/day with the most rapid decline (weeks) at high nitrate levels. Plant loss resulted from death of the meristem tissue. van Katwijk et al. (1999) - adverse effects of nitrate were dependent on salinity. Estuarine plants were more intolerant of high nitrate concentration than marine ; both populations benefited from nitrate enrichment (0-4 to 6.3 µmMolar nitrate per day) at 23 or 26 psu. Den Hart og (1994) - growth of a dense blanket of Ulva radiata in Langstone Harbour in 1991 resulted in the loss of 10ha of Z. marina and Z. noltii. By summer 1992, the Z. sp. were absent, however this may have been exacerbated by Brent geese grazing. Philippart (1995b) - shading by periphyton reduced incident light reaching the leaves of Z. noltii by 10-90% and reduced the period of time for net photosynthesis by 2-80% depending on location. Philippart (1995b) - the mud-snail Hydrobia ulvae could remove 25-100% of the periphyton and microphytobenthos; suggested that the decline of Z. noltii in the Wadden Sea in the 1970s was in part due to increased periphyton growth due to eutrophication, and a simultaneous decline of the mud-snail population. Encouragement of phytoplankton blooms increase turbidity and reduce light penetration, although this may be of less significance for intertidal Z. noltii populations (Davison & Hughes, 1998). Levels of phenolic compounds in Z. sp. are reduced under nutrient enrichment may increase susceptibility to infection by wasting disease (Buchsbaum et al., 1990; Burkholder et al., 1992). Long-term increases in nutrients or eutrophication may result in loss of the intertidal eelgrass beds. | Very High (Common Eelgrass) / Low | |
Ecological Receptor | Environmental Change Factor & Sensitivity Details | Sensitivity | |
Laminaria digitata (Oarweed) | S | Increased siltation can increase turbidity and reduce available light for photosynthesis. Lyngby & Mortensen (1996) - an increase in the level of suspended sediment may significantly reduce growth of Laminaria plants. Germlings, gametophytes and spores are probably more intolerant of siltation. Combined with water movements sediments can abrasively scour surfaces of settled spores. Development of Saccharina latissima (studied as Laminaria saccharina) gametophytes, for example, was inhibited by silt and failed to form an attachment when settling out on silty surfaces (Norton, 1978). However Laminaria saccharina is more tolerant of siltation and may out-compete Laminaria digitata in high silt environments. Heavy siltation may also result in smothering of plants | Low |
HM | Zinc was found to inhibit growth in Laminaria digitata at a concentration of 100µg/L and at 515µg/L growth had almost completely ceased (Bryan, 1969). Axelsson & Axelsson (1987) investigated the effect of exposure to mercury (Hg), lead (Pb) and nickel (Ni) for 24 hours by measuring ion leakage to indicate plasma membrane damage. Inorganic and organic Hg concentrations of 1mg/L resulted in the loss of ions equivalent to ion loss in seaweed that had been boiled for 5 minutes. Laminaria digitata was unaffected when subjected to Pb and Ni at concentrations up to 10mg/L. The results also indicate that the species is intolerant of the tin compounds butyl-Sn and phenyl-Sn. | Low | |
H | The toxic effects of oil on algae fall into two categories: those associated with coating of the plant and those due to uptake of hydrocarbons resulting in disruption of cellular metabolism. Reductions in photosynthesis rates are correlated with the thickness of the oil layer. Less susceptible to coating than some other seaweeds because of its preference for exposed locations where wave action will rapidly dissipate oil. Thought to be largely protected from oil penetration damage by the presence of a mucilaginous coating (O'Brian & Dixon, 1976). Effects of oil accumulation on the thalli are mitigated by the perennial growth of kelps. No significant effects of the Amoco Cadiz spill were observed for Laminaria populations and the World Prodigy spill of 922 tons of oil in Narragansett Bay had no discernible effects on Laminaria digitata (Peckol et al., 1990). The upper limit of distribution for Laminaria digitata moved up wave exposed shores by as much as 2m during the first few years after the Torrey Canyon oil spill due to the death of animals that graze the plants (Southward & Southward, 1978). Mesocosm studies in Norwegian waters showed that chronic low level oil pollution (25µg/L) reduced growth rates in Laminaria digitata but only in the second and third years of growth (Bokn, 1985). | Low | |
N | Growth is generally expected to be limited by nitrogen in the summer period. A comparison of Laminaria digitata growth rates in Arbroath, Scotland with a more oligotrophic and a more eutrophic site appears to support this hypothesis (Davison et al., 1984). In Helgoland, where ambient nutrient concentrations are double those of the Scotland site Laminaria digitata grows in the summer months. Laminaria digitata does not accumulate the significant internal reserves seen in some other kelps. Higher growth rates have also been associated with plants situated close to sewage outfalls. However, after removal of sewage pollution in the Firth of Forth, Laminaria digitata became abundant on rocky shores from which they had previously been absent. Therefore, although nutrient enrichment may benefit Laminaria digitata, the indirect effects of eutrophication, such as increased light attenuation from suspended solids in the water column and interference with the settlement and growth of germlings, may be detrimental. | Low | |
Hippocampus hippocampus (short snouted seahorse) | S | Hippocampus hippocampus does not rely on increases in suspended sediments to increase food availability as it feeds by predation. The seagrass habitats of Hippocampus hippocampus are likely to be intolerant of increases in suspended sediment which may result in a loss of habitat. However, Hippocampus hippocampus is mobile and may find more suitable conditions if necessary. Therefore, intolerance has been assessed as low with a very high recoverability. | Very Low |
HM | No information was found concerning the effects of heavy metals on Hippocampus hippocampus. | Insufficient information | |
H | No information was found concerning the effects of hydrocarbons on Hippocampus hippocampus. | Insufficient information | |
N | As Hippocampus hippocampus is a predator it is not reliant on nutrients for growth, however, a change in nutrients would affect the quality of the water and the availability of the prey of Hippocampus hippocampus. However, no information was found concerning the direct effects of nutrients on Hippocampus hippocampus. | Insufficient information | |
Ecological Receptor | Environmental Change Factor & Sensitivity Details | Sensitivity | |
Pomatoschistus microps (Common goby) | S | Moore (1977) indicated that an increase in siltation can have a negative effect on the growth of adult fish, survival of eggs and larvae and pathological effects on gill epithelia. Juveniles have been reported as being more intolerant of siltation than adults ( Moore , 1977). Bottom-dwelling species are generally found to be tolerant of suspended solids ( Moore , 1977). Pampoulie et al. (2000) reported the fecundity and egg size increased with increased turbidity. Therefore, intolerance to siltation has been recorded as low. Recoverability is likely to be very high (see additional information section below). Moore (1977) indicated that an increase in siltation can have a negative effect on the growth of adult fish, survival of eggs and larvae and pathological effects on gill epithelia. Juveniles have been reported as being more intolerant of siltation than adults ( Moore , 1977). Bottom-dwelling species are generally found to be tolerant of suspended solids ( Moore , 1977). Pampoulie et al. (2000) reported the fecundity and egg size increased with increased turbidity. Therefore, intolerance to siltation has been recorded as low. Recoverability is likely to be very high (see additional information section below). | Very Low |
HM | Cadmium, mercury, lead, zinc and copper are highly persistent, have the potential to bioaccumulate significantly and are all considered to be very toxic to fish (Cole et al., 1999). Mueller (1979) found that inPomatoschistus sp., very low concentrations of cadmium, copper and lead (0.5 g/l Cd2+; 5 g/l Cu2+; 20 g/l Pb2+) brought about changes in activity and an obstruction to the gill epithelia by mucus. Inorganic mercury concentrations as low as 30 µg/l (96-h LC50) are considered to be toxic to fish, whereas organic mercury concentrations are more toxic to marine organisms (World Health Organisation, 1989, 1991). Oertzen et al. (1988) found that the toxicity of the organic mercury complex exceeded that of HgCl2 by a factor of 30 for Pomatoschistus microps. Therefore, a high intolerance to heavy metals has been recorded. Recoverability is likely to be high. | Moderate | |
H | Toxicity of low molecular weight poly-aromatic hydrocarbons (PAH) to organisms in the water column is moderate (Cole et al., 1999). They have the potential to accumulate in sediments and, depending on individual PAH, to be toxic to sediment dwellers at levels between 6 and 150 µg/l (Cole et al., 1999). The toxicity of oil and petrochemicals to fish ranges from moderate to high (Cole et al., 1999). The main problem is due to smothering of the intertidal habitat. Bowling et al. (1983) found that anthracene, a PAH, had a photo-induced toxicity to the bluegill sunfish. In fact, they reported that when exposed to sunlight anthracene was at least 400 times more toxic than when no sunlight was present. According to Ankley et al. (1997) only a subset of PAH's are phototoxic (fluranthene, anthracene, pyrene etc.). Effects of these compounds are destruction of gill epithelia, erosion of skin layers, hypoxia and asphyxiation (Bowling et al., 1983). It is possible that Pomatoschistus microps could be similarly intolerant of hydrocarbons, however this is not known. An intermediate intolerance to hydrocarbons has been recorded. Recoverability is likely to be high. | Low | |
N | No information was available concerning the common goby and its intolerance to nutrient levels. However, it is probably relatively tolerant of variations in nutrient concentrations. | Insufficient information | |
Pomatoschistus minutus (Sand goby) | S | Moore (1977) indicated that an increase in siltation can have a negative effect on the growth of adult fish, survival of eggs and larvae and pathological effects on gill epithelia. However, bottom-dwelling species are generally found to be tolerant of suspended solids and juveniles have been reported as being more intolerant of siltation than adults ( Moore , 1977). Araújo et al. (2000) found that Pomatoschistus minutus was preferentially found in areas of high suspended sediment in the Thames estuary. On balance, tolerant has been suggested with a low confidence. | Not sensitive |
HM | Cadmium, mercury, lead, zinc and copper are highly persistent, have the potential to bioaccumulate significantly and are all considered to be very toxic to fish (Cole et al., 1999). Mueller (1979) found that in Pomatoschistus sp., very low concentrations of cadmium, copper and lead (0.5 g/l Cd2+; 5 g/l Cu2+; 20 g/l Pb2+) brought about changes in activity and an obstruction to the gill epithelia by mucus. Inorganic mercury concentrations as low as 30 µg/l (96-h LC50) are considered to be toxic to fish, whereas organic mercury concentrations are more toxic to marine organisms (World Health Organisation, 1989, 1991). Oertzen et al. (1988) found that the toxicity of the organic mercury complex exceeded that of HgCl2 by a factor of 30 for Pomatoschistus microps. As Pomatoschistus microps and Pomatoschistus minutus are similar in their distribution and morphology (Wiederholm, 1987) it is probable that Pomatoschistus minutus would react in the same way. Therefore, a high intolerance to heavy metals has been recorded. Recoverability is likely to be high. | Moderate | |
Ecological Receptor | Environmental Change Factor & Sensitivity Details | Sensitivity | |
Pomatoschistus minutus (Sand goby) | H | Toxicity of low molecular weight poly-aromatic hydrocarbons (PAH) to organisms in the water column is moderate (Cole et al., 1999). They have the potential to accumulate in sediments and, depending on individual PAH, to be toxic to sediment dwellers at levels between 6 and 150 µg/l (Cole et al., 1999). The toxicity of oil and petrochemicals to fish ranges from moderate to high (Cole et al., 1999). Berge et al. (1983) performed an experiment on the effects of the water soluble fraction (WSF) of North Sea crude oil on sand gobies. They found that after 1 to 2 days exposure to WSF crude oil at a concentration of 0.1 to 1.0 ppm, there was increased mortality and decrease in normal nocturnal behaviour. After 6 days exposure, a 50 % survival was noted. Berge et al. (1983) also noted that, after restoration of clean sea water normal activity resumed and mortality gradually became less, although some fish still died. Bowling et al. (1983) found that anthracene, a PAH, had a photo-induced toxicity to the bluegill sunfish. In fact, Bowling et al. (1983) reported that when exposed to sunlight, anthracene was at least 400 times more toxic than when no sunlight was present. According to Ankley et al. (1997) only a subset of PAH's are phototoxic (fluranthene, anthracene, pyrene etc.). Effects of these compounds are destruction of gill epithelia, erosion of skin layers, hypoxia and asphyxiation (Bowling et al., 1983). It is possible that Pomatoschistus minutus could be similarly intolerant of hydrocarbons, however this is not known. An intermediate intolerance to hydrocarbons has been recorded. Recoverability is likely to be high. | Low |
N | An increase or decrease in nutrient levels is not likely to exert an effect on the sand goby. | Not sensitive | |
Pholas dactylus (Common paddock) | S | Intolerance to siltation is likely to be low because Pholas dactylus produces sediment in the process of burrow drilling. This sediment is eliminated by taking it into the mantle cavity and then ejecting it with the pseudofaeces through the gut. Experimental work with Pholas dactylus showed that large fragments are either rejected immediately in the pseudofaeces or passed very quickly through the gut (Knight, 1984). An increase in the organic content of suspended sediment is likely to be beneficial to suspension feeders such as the common piddock. Occurrence of Pholas dactylus has been recorded from silty habitats in north Yorkshire (JNCC, 1999). | Low |
HM | Bryan (1984) states that Hg is the most toxic metal to bivalve molluscs while Cu, Cd and Zn seem to be most problematic in the field. In bivalve molluscs Hg was reported to have the highest toxicity, mortalities occurring above 0.1-1 µg/l after 4-14 days exposure (Crompton, 1997), toxicity decreasing from Hg > Cu and Cd > Zn > Pb and As > Cr ( in bivalve larvae, Hg and Cu > Zn > Cd, Pb, As, and Ni > to Cr). In investigations of faunal distribution in the metal contaminated Restronguet Creek in the Fal estuary bivalve molluscs appear to be the most vulnerable (Bryan, 1984). The bivalve Scrobicularia plana, for example, is absent from large areas of the intertidal muds where, under normal conditions, it would account for a large amount of the biomass (Bryan & Gibbs, 1983). Bryan (1984) also reports that metal-contaminated sediments can exert a toxic effect on burrowing bivalves and so intolerance has been assessed as intermediate. The embryonic and larval stages of bivalves are the most intolerant of heavy metals (Bryan, 1994). Pholas dactylus spawns for several months every year, so when normal conditions resume rapid recolonization by the pelagic larvae is likely. | Low | |
H | Insufficient information. | Insufficient Information | |
N | Insufficient information. | Insufficient Information | |
Phymatolithon calcareum (Maerl) | S | Increased siltation will cause deposition of a thin layer of material on the surface of the algae blocking incident light and preventing photosynthesis. There is no mechanism for clearing this material. Increased siltation may also fill up the spaces between the nodules changing the substratum. Phymatolithon calcareum is found on a wide variety of substrata so this is likely to be less of a problem. Sexual reproduction is virtually unknown in British Isles populations. Once a population has become extinct, the lack of propagules means that it is unlikely that it will be re-established. Even if reproductive propagules arrive from elsewhere, with the very slow growth rate of Phymatolithon calcareum, it will take a very long time to re-establish a similar population. | Very High |
HM | Insufficient information | Insufficient information | |
H | Insufficient information | Insufficient information | |
N | Cabioch (1969) suggested that maerl was tolerant to increases in nutrients. However, the growth of ephemeral algae may be increased, resulting in smothering of the maerl and restriction of photosynthesis. Following removal of the excessive ephemeral algae it should not take too long for the population to return to normal. | Very Low | |
Ecological Receptor | Environmental Change Factor & Sensitivity Details | Sensitivity | |
Ostrea edulis (Native oyster) | S | Oysters can reject unwanted particles (Yonge, 1926) and respond to an increase in suspended sediment by increasing pseudofaeces production with occasional rapid closure of their valves to expel accumulated silt (Yonge, 1960) both of which exert an energetic cost. Korringa (1952) reported that an increase in suspended sediment decreased the filtration rate in oysters. This study is supported by Grant et al. (1990) who found declining clearance rates in Ostrea edulis in responds to an increase in suspended particulate matter. Suspended sediment was also shown to reduce the growth rate of adult Ostrea edulis and results in shell thickening ( Moore , 1977). Reduced growth probably results from increased shell deposition and an inability to feed efficiently. Hutchinson & Hawkins (1992) reported that filtration was completely inhibited by 10 mg/l of particulate organic matter and significantly reduced by 5 mg/l. Ostrea edulis larvae survived 7 days exposure to up to 4 g/l silt with little mortality. However, their growth was impaired at 0.75 g/l or above ( Moore , 1977). Ostrea edulis is less well adapted to silted conditions than other species, e.g. Crassostrea virginica (Yonge, 1960). Yonge (1960) and Korringa (1952) considered Ostrea edulis to be intolerant of turbid environments. For example, Yonge (1960) reported smothering of oyster beds after flooding (see above). However, oyster beds are found in the relatively turbid estuarine environments and the values of suspended sediment quoted above are high in comparison to the benchmark value. Therefore, a change in suspended sediment at the benchmark level may only result in sub-lethal effects and an intolerance of low has been recorded. Moore (1977) reported that variation in suspended sediment and silted substratum and resultant scour was an important factor restricting oyster spatfall, i.e. recruitment. Therefore, an increase in suspended sediment may have longer term effects of the population by inhibiting recruitment, especially if the increase coincided with the peak settlement period in summer. Once 'normal' conditions are restored then normal feeding will resume. | Very Low |
HM | In heavily polluted estuaries, e.g. Restronguet Creek in the Fal estuary, oyster flesh is known to turn green due to the accumulation of copper Cu. (Yonge, 1960; Bryan et al. 1987). Bryan et al. (1987) noted that Cu and Zn were accumulated in the tissues of Ostrea edulis, estimates ranging from ca 1000 to ca 16,500 µg/g dry weight, which would probably be toxic for human consumption. However, Ostrea edulis, is therefore tolerant of high levels of Cu and Zn and is able to survive in the lower reaches of Restronguet Creek, where other species are excluded by the heavy metal pollution. However, larval stages may be more intolerant, especially to Hg, Cu, Cd and Zn. Bryan (1984) reported at 48hr LC50 for Hg of 1-3.3 ppb in Ostrea edulis larvae compared with a 48hr LC50 for Hg of 4200ppb in adults. Therefore, although the adults may be tolerant of heavy metal pollution the larval effects suggest that recruitment may be impaired resulting in a reduction in the population over time. Therefore an intolerance of intermediate has been recorded. Recovery will depend on recruitment, which is sporadic and a recoverability of low has been recorded. | High | |
H | Oil and its fractions has been shown to result in reduced feeding rates in bivalves (e.g. Crassostrea sp.) (Bayne et al., 1992; Suchanek, 1993). Oils and their fractions have also been shown to cause genetic abnormalities in Crassostrea virginica. Oysters and other bivalves are known to accumulate hydrocarbons in their tissues (Clark, 1997). Polyaromatic hydrocarbons were shown to reduce the scope for growth in Mytilus edulis and may have a similar effect in other bivalves. Therefore, an intolerance of low has been recorded. | Very Low | |
Ecological Receptor | Environmental Change Factor & Sensitivity Details | Sensitivity | |
Ostrea edulis (Native oyster) | N | The species can do well in estuarine environments which frequently have higher levels of nutrients than the open coast. Nutrient concentration may have no effect on the oysters themselves. However, the oysters may benefit indirectly through the enhanced growth of microalgae (on which they feed) with increased levels of nutrients. Long term or high levels of organic enrichment may result in eutrophication and have indirect adverse effects, such as increased turbidity, increased suspended sediment (see above), increased risk of deoxygenation (see below) and the risk of algal blooms. Ostrea edulis has been reported to suffer mortality due to toxic algal blooms, e.g. blooms of Gonyaulax sp. and Gymnodinium sp. (Shumway, 1990). The subsequent death of toxic and non-toxic algal blooms may result in large numbers of dead algal cells collecting on the sea bottom, resulting in local de- oxygenation as the algal decompose, especially in sheltered areas with little water movement | Not Sensitive |
Ascophyllum nodosum (Knotted wrack) | S | Siltation may cover some surfaces of the plant, reducing photosynthesis rates which may reduce growth rates. However, the species naturally occurs in places of high siltation, such as estuaries and very sheltered areas, so is likely to be tolerant of this factor. Upon return to normal conditions the photosynthesis rate would quickly return to normal. | Not Sensitive |
HM | Disappearance from Oslofjord has been attributed to an increase in pollution and copper at concentrations of 1039nM (66µg/L) have been found to inhibit growth (Strömgren, 1979a). Adult plants appear to be fairly robust in the face of heavy metal pollution (Holt et al., 1997) and intolerance is reported to be low. For example, the species penetrates into the metal polluted middle reaches of Restronguet Creek in the Fal estuary system where concentrations of both copper and zinc are in the region of 1000-2000µg/g in the sediment and 10-100µg/l in seawater (Bryan & Gibbs, 1983). Although Ascophyllum nodosum accumulates copper this can be removed because the species naturally sheds its epidermis at regular intervals (Stengel & Dring, 2000). Earlier life stages of Ascophyllum nodosum are probably more sensitive than adult plants. Therefore on return to normal conditions growth rates should gradually return to normal. | Low | |
H | Experimental studies have found that long-term exposure to low levels of diesel reduces the growth rate in Ascophyllum nodosum. For example, in mesocosm experiments, Bokn (1987) observed growth inhibition at a diesel concentration of 130 ppb and that inhibition stops when the oil is removed. Thus, a limited amount of oil pollution need not be detrimental to a population with good recruitment (Sjoetun & Lein, 1993). However, Ascophyllum nodosum generally has poor recruitment so populations may take a long time to recover and hydrocarbon contamination may also prevent fertilization and germination and hence recruitment. If plants are heavily oiled the fronds can become severely overweighted by oil and be broken by waves. This may be no more detrimental than a severe storm if a few blades are lost, but the loss of too many blades can be harmful (Lobban & Harris on, 1997). | Low | |
N | Able to accumulate nitrogen in its tissues in response to seasonal availability. A reduction in the level of nutrients could reduce growth rates in Ascophyllum nodosum. A slight increase in nutrients may enhance growth rates but high nutrient concentrations could lead to the overgrowth of the algae by ephemeral green algae. Ascophyllum nodosum plants, when transplanted into sewage-stressed areas have become heavily infested with epiphytes and frequently overgrown by Ulva species and there are reports of a decline in populations of the species in the North Atlantic as a result of increased eutrophication (Fletcher, 1996). On return to normal nutrient levels the growth rate would be quickly restored. | Low | |
Ecological Receptor | Environmental Change Factor & Sensitivity Details | Sensitivity | |
Modiolus modiolus(Horse mussel) | S | Found in a variety of turbid and clear water conditions (Holt et al., 1998). Muschenheim & Milligan (1998) noted that the height of the horse mussels beds in the Bay of Fundy positioned them within the region of high quality seston while avoiding high levels of re-suspended inorganic particulates (2.5- 1500mg/l) at the benthic boundary layer. Comely (1978) noted that a population in a high turbidity area (up to 14mg/l inorganic suspended particulates) showed excessive pearl formation and poor shell growth and condition, although the populations poor condition was probably partly due to old age and senility. Therefore, although high levels of suspended sediment may interrupt feeding, or result in the production of pseudofaeces at energetic cost, Modiolus modiolus is probably able to tolerate increases in suspended sediment for intervals equivalent to the benchmark and an intolerance of low has been recorded. Increases in organic suspended particulates may increase food availability and be beneficial. Modiolus modiolus is adapted to a benthic sediment habitat and is probably capable of rejecting excess silt or particulates, therefore a recoverability of 'immediate' has been recorded. | Not sensitive |
HM | May exhibit tolerance to heavy metals. The tissue distribution of Cd, Zn, Cu, Mg, Mn, Fe and Pb was examined in Modiolus modiolus by Julshamn & Andersen (1983) who reported the presence of Cd binding proteins but did not document any adverse affects. Richardson et al. (2001) examined the presence of Cu, Pb and Zn in the shells of Modiolus modiolus from a relatively un-contaminated site and from a site affected by sewage sludge dumping. The persistence of a population of horse mussels at the sewage sludge dumping site suggests tolerance to heavy metal contamination levels at that site. Holt et al. (1998) reported that long-term changes in contaminant loads associated with spoil dumping were detectable in the shells of horse mussels in a bed off the Humber estuary. This observation showed survival of horse mussels in the vicinity of a spoil dumping ground but no information on their condition was available (Holt et al., 1998). Overall, therefore, horse mussels may show a similar tolerance to heavy metals as Mytilus edulis but in the absence of any evidence of mortalities an intolerance of low has been recorded. On return to un-contaminated conditions, removal or depuration of heavy metals may take some time and a recoverability of very high has been recorded. | Very Low | |
H | Protected from the direct effects of oil spills due to their subtidal habitat, although shallow subtidal and intertidal populations will be more vulnerable. Horse mussels may still be affected by oil spills and associated dispersants where the water column is well mixed vertically, e.g. in areas of strong wave action. Oils may be ingested as droplets or adsorbed onto particulates. Hydrocarbons may be ingested or absorbed from particulates or in solution, especially PAHs. Suchanek (1993) - sub-lethal levels of oil or oil fractions reduce feeding rates, reduce respiration and hence growth, and may disrupt gametogenesis in bivalve molluscs. Widdows et al. (1995) - the accumulation of PAHs contributed to a reduced scope for growth in Mytilus edulis. Holt & Shalla (unpublished; cited in Holt et al., 1998) no visible affects on a population of Modiolus modiolus within 50 m of the wellhead of a oil/gas exploration rig (using water based drilling muds) in the north east of the Isle of Man. May & Pearson (1995) reviewed the effects of the oil industry on the macrobenthos of Sullom Voe. They reported that stations in the vicinity of ballast water diffuser, probably containing fresh petrogenic hydrocarbons, showed a consistently high diversity (since surveys started in 1978) and included patches of Modiolus beds. The strong currents in the area probably flushed polluting materials away from the station, and hence reduced the stress on the population (May & Pearson, 1995). However, is it possible that hydrocarbon contamination may reduce reproductive success and growth rates in horse mussel populations. Reduced scope for growth may be of particular importance in juveniles that are subject to intense predation pressure, resulting in fewer individuals reaching breeding age. However, the long term persistence of a diverse bed of Modiolus sp. in the vicinity of a hydrocarbon contaminated effluent suggests an intolerance of low. Recruitment is sporadic and variable therefore it may take many years for a population to recover from damage and a recoverability of low (10-25years) has been recorded. | Very Low | |
Ecological Receptor | Environmental Change Factor & Sensitivity Details | Sensitivity | |
Modiolus modiolus(Horse mussel) | N | Navarro & Thompson (1996) suggested that Modiolus modiolus was adapted to an intermittent and often inadequate food supply. The persistence of a horse mussel population in the vicinity of a sewage sludge dumping site (Richardson et al., 2001) suggests that the species is tolerant of high nutrient levels. Moderate nutrient enrichment may, therefore, be beneficial by increasing phytoplankton productivity and organic particulates, and hence food availability. Therefore, a rank of 'tolerant*' has been recorded. However, eutrophication may have indirect adverse effects, such as increased turbidity, increased risk of deoxygenation (see above) and the risk of algal blooms. Shumway (1990) reviewed the effects of algal blooms on shellfish and reported that a bloom of Gonyaulax tamarensis(Protogonyaulax) was highly toxic to Modiolus modiolus. Shumway (1990) also noted that both Mytilus spp. and Modiolus spp. accumulated paralytic shellfish poisoning (PSP) toxins faster than most other species of shellfish, e.g. horse mussels retained Gonyaulax tamarensis toxins for up to 60 days (depending on the initial level of contamination). Landsberg (1996) also suggested that there was a correlation between the incidence of neoplasia or tumours in bivalves and out-breaks of paralytic shellfish poisoning in which bivalves accumulate toxins from algal blooms, although a direct causal effect required further research. Therefore, an intolerance of low (at the benchmark level) has been recorded due to the potential sub-lethal effects of algal blooms. A recoverability of very high has been recorded to represent the time required for algal toxins to be depurated from horse mussels. | Very Low |
Gobius cobitis (Giant goby) | S | Moore (1977) indicated that an increase in siltation can have a negative effect on the growth of adult fish, survival of eggs and larvae and pathological effects on gill epithelia. Bottom-dwelling species are generally found to be tolerant of suspended solids ( Moore , 1977). Juveniles have been reported as being more intolerant of siltation than adults ( Moore , 1977). Therefore, a low intolerance to siltation has been recorded. Recoverability is likely to be high. | Low |
HM | Cadmium, mercury, lead, zinc and copper are highly persistent, have the potential to bioaccumulate significantly and are all considered to be very toxic to fish (Cole et al., 1999). Mueller (1979) found that in Pomatoschistus sp., a different species of goby, very low concentrations of cadmium, copper and lead (0.5 g/l Cd2+; 5 g/l Cu2+; 20 g/l Pb2+) brought about changes in activity and an obstruction to the gill epithelia by mucus. This may also be true for Gobius cobitis. Inorganic mercury concentrations as low as 30 µg/l (96-h LC50) are considered to be toxic to fish, whereas organic mercury concentrations are more toxic to marine organisms (World Health Organisation, 1989, 1991). Oertzen et al. (1988) found that the toxicity of the organic mercury complex exceeded that of HgCl2 by a factor of 30 for Pomatoschistus microps. Therefore, a high intolerance to heavy metals has been recorded. Recoverability is likely to be high. | Moderate | |
H | No information was available regarding specific toxicity to gobies. However, it is known that toxicity of low molecular weight poly-aromatic hydrocarbons (PAH) to organisms in the water column is moderate (Cole et al., 1999). They have the potential to accumulate in sediments and, depending on individual PAH, can be toxic to sediment dwellers at levels between 6 and 150 µg/l (Cole et al., 1999). The toxicity of oil and petrochemicals to fish ranges from moderate to high (Cole et al., 1999), the main problem being smothering of the intertidal habitat. Bowling et al. (1983) found that anthracene, a PAH, had a photo-induced toxicity to the bluegill sunfish. In fact, they reported that when exposed to sunlight anthracene was at least 400 times more toxic than when no sunlight was present. According to Ankley et al. (1997) only a subset of PAH's are phototoxic (fluoranthene, anthracene, pyrene etc.). Effects of these compounds are destruction of gill epithelia, erosion of skin layers, hypoxia and asphyxiation (Bowling et al., 1983). It is possible that Gobius cobitis could be similarly intolerant of hydrocarbons, however this is not known. An intermediate intolerance to hydrocarbons has been recorded. Recoverability is likely to be high. | Low | |
Ecological Receptor | Environmental Change Factor & Sensitivity Details | Sensitivity | |
Gobius cobitis (Giant goby) | N | Higher nutrient levels may encourage the growth of algae such as Ulva spp., which is the main food source for Gobius cobitis. In comparison, a decrease in nutrient levels may lead to a decrease in the availability of green algae. However, this is likely to exert a slight effect on the giant goby as it is able to ingest other types of food (such as Crustacea and Polychaeta). Therefore, a low intolerance to nutrients has been recorded. Recoverability is likely to be high. | Low |
Pachycerianthus multiplicatus (Fireworks anemone) | S | Pachycerianthus multiplicatus occurs in muddy sediments, so is likely to be tolerant of some level of suspended sediment. However there may be an energetic cost of removing mud particles. Therefore intolerance is recorded as low. Recoverability is recorded as immediate, resulting in a sensitivity assessment not sensitive. | Not sensitive |
HM | Insufficient information | Insufficient information | |
H | Insufficient information | Insufficient information | |
N | No information could be found on the effects of nutrient enrichment on Pachycerianthus multiplicatus. It is possible that an increase in nutrients will result in greater food availability, as the anemone feeds on plankton. However any deoxygenation associated with the decomposition of organic material is likely to kill Pachycerianthus multiplicatus (Hughes 1998a). | Insufficient information | |
Eunicella verrucosa (Pink sea fan) | S | Colonies produce mucus to clear themselves of silt and therefore, although siltation might occur and inhibit feeding for a while, the silt will be removed by water movement or mucus. | Very Low |
HM | No information found. | Insufficient information | |
H | No information found. | Insufficient information | |
N | It is not expected that a change in nutrients will have a significant effect on Eunicella verrucosa abundance and survival. Sea fans feed on planktonic organisms and, although abundance of those organisms might change as nutrient concentrations vary, the long term effects on food sources are not likely to be significant. However, algae colonize and may smother sea fans and may increase in abundance as a result of increase in nutrient concentrations. | Not sensitive | |
Palinurus elephas (European spiny lobster) | S | An increase in the amount of suspended sediment is unlikely to affect Palinurus elephas directly. However, over the course of the benchmark, and depending on local hydrographic conditions, siltation may occur on the rocky substratum on which this species prefers. An increase in the amount of fine particulates, although unlikely to significantly change the nature of the substratum over the benchmark period, may alter the proportion of different prey items available to the lobster. However, since Palinurus elephas are active omnivores, such a change is unlikely to reduce total ingestion over the benchmark period and tolerant has been suggested. | Not sensitive |
HM | Insufficient information | Insufficient information | |
H | Insufficient information | Insufficient information | |
N | Insufficient information | Insufficient information | |
Ecological Receptor | Environmental Change Factor & Sensitivity Details | Sensitivity | |
Atrina fragilis (Fan mussel) | S | Pinnids are adapted to a sedimentary lifestyle and possess a unique ciliated waste canal for the removal of sediment from the mantle cavity (Yonge 1953). However, increased siltation will require increased metabolic demand on filtration and a likely decrease in growth and reproductive capacity. Thrush et al. (1999) demonstrated a decrease in the biochemical condition in Atrina zealandica with increasing sediment load in the Mahurangi Estuary, New Zealand. Along an increasing suspended sediment gradient, long term negative effects on the biomass and growth of Atrina zelandica were observed (Ellis et al., 2002). Negative effects on condition of Atrina zelandica became apparent after only 3 days of exposure to increased suspended sediment levels, and clearance rates increased with increasing sediment loading, up to a threshold level, above which clearance rates decrease rapidly. Clearance rates of suspended sediment were lower at higher sediment concentrations (Ellis et al., 2002). It may be that Atrina zelandica found in areas with naturally high sediment loading are adapted to cope better with increases in suspended sediment than those from areas with lower background sediment concentrations. None the less, very large increases in suspended sediment are still likely to be detrimental to Atrina zelandica (Hewitt & Pilditch, 2004). Pinna bicolor and Pinna nobilis occur in sheltered areas of low turbidity. However, juveniles settle in the boundary layer and grow rapidly to escape the high levels of sediment and it is likely that Pinnids are tolerant of suspended sediment. The absence of Pinna sp. from areas of severe sediment disturbance (Bulter et al. 1993) suggests that the populations in areas of high sediment availability will be adversely affected by increased siltation. Because adults are likely to cleanse themselves relatively quickly, intolerance of Atrina fragilis to this factor has been assessed as low. Recovery is likely to be very high, hence an overall sensitivity assessment of very low. | Very Low |
HM | Anon (1999c) suggested that Atrina fragilis may be affected by pollutants such as TBT (tri-butyl tin). Reid & Brand (1989) describe kidney gigantism and nephroliths (calcium or iron granules) in Pinna bicolor. Their role in removing excess calcium or heavy metals and potential detoxification is unclear. Ward & Young (1983) examined changes in epifauna of Pinna bicolor due to heavy metal contamination in Spence Gulf, south Australia. They state that Pinna bicolor is tolerant of high concentrations of heavy metals in sediments near a lead smelter and contains high body loads of heavy metals. The occurrence of populations of this species in heavy metal contaminated sediment suggests that it is not sensitive. However, the body burden of Pinna bicolor was not given and no citation provided for the information. The studied population may represent a localised adaptation. Due to incomplete information, intolerance has been recorded as low, yielding a moderate sensitivity value. | Moderate | |
H | Insufficient information | Insufficient information | |
N | Pinnids are mainly found in sheltered oligotrophic (low nutrient) waters (Butler et al. 1993), and they filter continuously, presumably an adaptation to low food availability. A small population of Atrina fragilis exists near a sewage discharge in Dingle Harbour (Dan Minchin pers comm.). An increase in nutrients is likely to increase phytoplankton production in the short term, which may benefit larvae and juveniles. Therefore intolerance has been assessed as low. Insufficient information was found on recover from excess nutrients, therefore a moderate sensitivity value has been recorded. | Moderate | |
Leptopsammia pruvoti (Sweet cup coral) | S | This species is permanently attached to the substratum and would be unable to avoid changes in siltation. However, the species tends to inhabit caves or overhangs which are less likely to be exposed to suspended material settling out. The polyp will most likely 'inflate' with water to expand above the silt if briefly covered. Increased siltation may clog feeding apparatus and there would be an energetic cost to clearing this sediment. Gamete production, synchronous gamete production or successful recruitment are very unpredictable and sporadic primarily due to unfavourable environmental conditions. Local recruitment has not been recorded at Lundy during more than 12 years of monitoring but occurred to a small extent in 1998. Local recruitment is most likely but may also be from distant water bodies perhaps every 25-30 years. There has been no observation of colonization of wrecks or new natural surfaces near to existing colonies such as the breakwater at Plymouth Sound constructed in the early 1800's. Recovery will take a very long time or may not occur at all. | High |
HM | Insufficient information | Insufficient information | |
H | Insufficient information | Insufficient information | |
N | Changes in nutrient concentration are unlikely to affect this species greatly unless there is a smothering effect through enhanced growth of ephemeral algae. High calcium levels may benefit skeleton construction. On removal of the factor, death of the algae etc and resumption of normal feeding, water flow etc, return to original condition should take only a short time. | Very Low | |
Ecological Receptor | Environmental Change Factor & Sensitivity Details | Sensitivity | |
Urticina felina (Dahlia anemone) | S | Being an epibenthic species, Urticina felina would be exposed to changes in siltation. Increases in siltation may begin to cover the anemone or interfere with feeding. An energetic cost will result from efforts to clean off the silt particles, e.g. through mucus production and sloughing. Repeated energetic expenditure in cleaning off silt particles may cause loss of condition. Recovery of condition may take several months. | Very Low |
HM | Insufficient information | Insufficient information | |
H | One month after the Torrey Canyon oil spill the dahlia anemone, Urticina felina, was found to be one of the most resistant animals on the shore, being commonly found alive in pools between the tide-marks which appeared to be devoid of all other animals (Smith, 1968). Intolerance is, therefore, assessed as low for dispersed or liquid oil. 'Condition' would be likely to return to normal once the oil is removed. However, the species may be susceptible to smothering effects and, in the case of thick oil, mortality seems likely. | Very Low | |
N | Insufficient information | Insufficient information | |
Metridium senile (Plumose anemone) | S | Metridium senile can produce mucus to clear itself of silt. The production of mucus may have an energetic consequence and an intolerance of low is recorded. | Not sensitive |
HM | No information has been found of accumulation or effects of heavy metals on Metridium senile. | Insufficient information | |
H | Metridium senile is a major component of jetty pile communities immediately adjacent to areas subject, in previous times, to the discharge of oily ballast and also, in Milford Haven, to a refinery effluent containing hydrocarbons (K. Hiscock, own observations). The anemone is able to produce mucus as a protective mechanism should oil settle onto individuals. No records have been found of any mortality of Metridium senileduring oil spills or of any experimental studies of effects. Therefore, although an intolerance of low is indicated, it is with low confidence. | Not sensitive | |
N | Metridium senile is a major component of jetty pile communities immediately adjacent to areas subject, in previous times, to the discharge of oily ballast and also, in Milford Haven, to a refinery effluent containing hydrocarbons (K. Hiscock, own observations). The anemone is able to produce mucus as a protective mechanism should oil settle onto individuals. No records have been found of any mortality of Metridium senileduring oil spills or of any experimental studies of effects. Therefore, although an intolerance of low is indicated, it is with low confidence. | Not sensitive* | |
Amphiura filiformis (brittlestar) | S | Amphiura filiformis is a passive suspension feeder. Increases in siltation of inorganic particles may interfere with the feeding of this species. However, the species live in burrows maintained by mucus so Amphiura filiformiscan tolerate slight increases in siltation by removing an excess of particles with mucus production. On the Northumberland coast Amphiura filiformis is abundant in an area close to a rich supply of fine sediment from coastal erosion and run- off (Buchanan, 1964). The supply is sufficient enough to produce a covering of fine silty sediment. Intolerance to siltation is therefore low. On return to normal conditions recovery is likely to be rapid. | Very low |
HM | Information about the effects of heavy metals on echinoderms is limited and no details specific to Amphiura filiformis, or any other brittlestars, were found. However, Bryan (1984) reports that early work has shown that echinoderm larvae are intolerant of heavy metals, e.g. the intolerance of larvae of Paracentrotus lividus to copper (Cu) had been used to develop a water quality assessment. LC50 concentrations exceeding 0.1 mg Cu L-1, 1 mg Zn L-1 and 10 mg Cr L-1 for a duration between 4 -14 days of exposure have been reported for echinoderm species (Table 5.12, Crompton, 1997). As some mortality is reported, intolerance is assessed as intermediate. Adult echinoderms such as Ophiothrix fragilis are known to be efficient concentrators of heavy metals including those that are biologically active and toxic (Hutchins et al., 1996). However, there is no information available regarding the effects of this bioaccumulation. | Low | |
Ecological Receptor | Environmental Change Factor & Sensitivity Details | Sensitivity | |
Amphiura filiformis (brittlestar) | H | In a study of the effects of oil exploration and production on benthic communities, Olsgard & Gray (1995) found Amphiura filiformis to be very intolerant of oil pollution. During monitoring of sediments in the Ekofisk oilfield Addy et al. (1978) suggest that reduced abundance of Amphiura filiformis within 2-3 km of the site was related to discharges of oil from the platforms and to physical disturbance of the sediment. Although acute toxicity test showed that drill cuttings containing oil based muds had a very low toxicity (LC50 52,800 ppm total hydrocarbons in test sediment) Newton & McKenzie (1998) suggest these toxicity tests are a poor predictor of chronic response. Chronic sub-lethal effects were detected around the Beryl oil platform in the North Sea where the levels of oil in the sediment were very low (3ppm) and Amphiura filiformis was excluded from areas nearer the platform with higher sediment oil content. However, the authors do suggest that effects may also be related to the non-hydrocarbon element of the cuttings such as metals, physical disturbance or organic enrichment. Amphiura filiformis is a host for symbiotic sub-cuticular bacteria. After exposure to hydrocarbons loadings of this bacteria were reduced indicating a possible sub-lethal stress to the host (Newton & McKenzie, 1995). However, since field evidence suggests reduced abundance some distance away from oil pollution, intolerance to hydrocarbons is assessed as high. Recovery to original numbers and population structure is likely to take longer than five years (see additional information) and so recovery is assessed as moderate. In addition, oil contamination is likely to remain in the sediment for a long time after the pollution source is removed. | Moderate |
N | Amphiura filiformis responds positively to increased organic enrichment (Nilsson, 1999). In the Skagerrak in the North Sea, a massive increase in abundance and biomass of the species between 1972 and 1988 is attributed to organic enrichment (Josefson, 1990). Rosenberg et al. (1997) also reported that Amphiura filiformisappeared to be more densely packed in the sediment when food occurred superabundantly compared to when food was less common. Sköld & Gunnarsson (1996) reported enhanced growth and gonad development in response to short-term enrichment of sediment cores containing Amphiura filiformis maintained in laboratory mesocosms. Individuals from the more densely populated offshore sediment did not experience enhanced somatic growth (unlike those from the less populated coastal site) indicating a negatively density-dependent relationship. Therefore, it appears that Amphiura filiformis can be tolerant* of increases in nutrients. However when increased organic input results in almost complete oxygen depletion, mortality of individuals will occur although this is dealt with in "oxygenation" (see below). For the most part it would appear that Amphiura filiformis may benefit from an increase in nutrients and tolerant* has been suggested. | Not sensitive* | |
Ophiothrix fragilis (Common brittlestar) | S | Ophiothrix fragilis is a passive suspension feeder. Increases in siltation of inorganic particles may interfere with the feeding of this species (Aronson, 1992 cited in Hughes, 1998), particularly in non current-swept areas. Respiration rate is low and the species can tolerate considerable loss of body mass during reproductive periods (Davoult et al., 1990) so restricted feeding may be tolerated. Once normal feeding recommences it may take a short time for condition to be regained. | Very Low |
HM | Adult echinoderms such as Ophiothrix fragilis are known to be efficient concentrators of heavy metals including those that are biologically active and toxic (Hutchins et al., 1996). There is no information available regarding the effects of this bioaccumulation. | Insufficient information | |
H | Echinoderms tend to be very sensitive to various types of marine pollution (Newton & McKenzie, 1995). AdultOphiothrix fragilis have documented intolerance to hydrocarbons (Newton & McKenzie, 1995). The sub-cuticular bacteria that are symbiotic with Ophiothrix fragilis are reduced in number following exposure to hydrocarbons. Exposure to 30,000 ppm oil reduces the bacterial load by 50 % and brittle stars begin to die (Newton & McKenzie, 1995). However, there are no field observations of mortalities caused by exposure to hydrocarbons. Breeding occurs annually and there may be multiple recruitment phases (Davoult et al., 1990). The larvae of this species can disperse over considerable distances in areas such as the English Channel where there are strong water flow rates (Davoult et al., 1990). With water that may move several kilometres per day due to residual flow (e.g. see Pingree & Maddock, 1977) and a larval duration of 26 days, the larvae can disperse up to 70-100 km and establish populations elsewhere. Adults, although mobile, are not highly active. Some immigration of adults from nearby populations may be possible. Longevity estimates vary from 9 months (Davoult et al., 1990) to over 10 years (Gage, 1990). Reproductive capability may be reached in 6-10 months depending on time of recruitment (Davoult et al., 1990). | Moderate | |
Ecological Receptor | Environmental Change Factor & Sensitivity Details | Sensitivity | |
Ophiothrix fragilis (Common brittlestar) | N | Decreases in sub-cuticular bacteria have also been recorded following nutrient limitation. Reductions in these bacteria are probably indicative of levels of stress and may lead to mortality (Newton & McKenzie, 1995). Breeding occurs annually and there may be multiple recruitment phases (Davoult et al., 1990). The larvae of this species can disperse over considerable distances in areas such as the English Channel where there are strong water flow rates (Davoult et al., 1990). With water that may move over several kilometres per day due to residual flow (e.g. see Pingree & Maddock, 1977) and a larval duration of 26 days, the larvae can disperse up to 70-100 km and establish populations elsewhere. This may preclude auto-recruitment of local populations (Davoult at al., 1990). Adults, although mobile, are not highly active. Some immigration of adults from nearby populations may be possible. Longevity estimates vary from 9 months (Davoult et al., 1990) to over 10 years (Gage, 1990). Reproductive capability may be reached in 6-10 months depending on time of recruitment (Davoult et al., 1990). | Low |
Asterias rubens (Common starfish) | S | Asterias rubens appears able to flourish in naturally turbid conditions, such as the north-east coast of England (P.G. Moore , personal observation) and River Crouch (Mistakidis, 1951 in Moore , 1977). Greve & Kinne (1971) noted that Asterias rubens would cleanse itself of adhering mud particles by secreting mucus ( Moore , 1977). However, Zafiriou et al., (1972) suggested that the behaviour of starfish may be modified by variations in suspended material. They found an apparent lessening in intensity of approach response of Asterias rubens to soluble oyster homogenate in turbid water. The disruption of feeding activity has implications for recruitment. Nutrient reserves in the pyloric caeca are an important source of energy for the process of gametogenesis and therefore the acquisition of food in the summer preceding spawning is an important factor in determining fecundity and consequently species viability. In light of this evidence a low intolerance is given. | Low |
HM | Temara et al., (1997) found that heavy metals are selectively distributed among body components of Asterias rubens: Hg concentrations were significantly higher in the pyloric caeca (0.15 µmg Hg g-1 dry weight) and the gonads (0.12 µmg Hg g-1); Zn, Cd, Fe and Cu were high in the pyloric caeca, whilst Pb was significantly more concentrated in the skeleton (8.73 µmg Pb g-1 dry weight). The affinity of Pb for calcite is high and Pb is readily adsorbed to the skeleton of echinoderms. In starfish toxic effects of Pb could come directly from its incorporation into the skeleton or could influence other metabolic pathways and exert an indirect deleterious effect on the species (Temara, et al., 1997). For instance, Pb adsorption occurs actively on the growing parts of the skeleton, where it could reduce skeletogenesis as Pb is one of the most effective inhibitors of calcite dissolution/precipitation kinetics (Morse, 1986). Heavy metals have also been reported to effect gametogenesis and early larval development in the starfishAsterias rubens. For example, Besten et al., (1991) examined the effects of cadmium on the gametogenesis in females of Asteria rubens, after short term exposure (5 weeks) to 200 µmg Cd l-1 and long term (7 months) exposure to 25 µmg Cd l-1 under semi-natural conditions. It became evident that a short term exposure to 200 µmg Cd l-1 affected gametogensis by reducing ovary growth. The early phase of gametogenesis was also found to be more susceptible to Cd exposure as experiments starting in February has less effect on ovary growth than those commencing in December. The long term exposure of female Asterias rubens to 25 µmg Cd l-1caused a delay in ovary growth which was evident after 5 months. The oocytes from cadmium exposed females have also been shown to produce defective offspring (Besten, et al., 1989). The aberrations were shown to occur at relatively low exposure levels, and the Cd concentrations found within the body of experimentally (long term) exposed Asterias rubens could also be found within specimens fed with mussels from polluted sites, such as the Dutch Western Scheldt. Consequently, Besten, et al., (1991) concluded that cadmium pollution poses a considerable threat to populations of Asterias rubens in terms of recruitment success. LC concentrations exceeding 0.1 mg Cu l-1, 1 mg Zn l-1 and 10 mg Cr l-1 for a duration between 4 -14 days of exposure have been reported for 50 echinoderm species (Table 5.12, Crompton, 1997). | Low | |
H | Asterias rubens is intolerant of hydrocarbon pollution: Bokn et al., (1993) examined of the long term effects of the water-accommodated fraction (WAF) of diesel oil on rocky shore populations. Two doses (average hydrocarbon concentration in diesel oil equivalents; High: = 129.4 µmg l-1, and Low = 30.1 µmg l-1) of WAF of diesel oil were delivered via sea water to established rocky shore mesocosms over a two year period. The numbers of Asterias rubens decreased at all tidal levels (even in the control mesocosms during the study) and Asterias rubens disappeared entirely from upper sublittoral samples in the mesocosm receiving a high dose of WAF diesel oil suggesting a negative effect upon this species caused by the high dose treatment. Crude oil from the Torrey Canyon in 1967 off Land's End of Cornwall, and the detergent used to disperse it caused mass mortalities of echinoderms; Asterias rubens, Echinocardium cordatum, Psammechinus miliaris, Echinus esculentus, Marthasterias glacialis and Acrocnida brachiata (Smith, 1968). However, Asterias rubens was found to be fairly resistant to the oil dispersant used, BP1002. A concentration of BP1002 at 25 ppm was required in toxicity tests to kill 50% of Asterias rubens within 24 hours (Smith, 1968). | Moderate | |
Ecological Receptor | Environmental Change Factor & Sensitivity Details | Sensitivity | |
Asterias rubens (Common starfish) | N | A population of Asterias rubens may benefit indirectly from an increased nutrient availability because major food items such as mussels filter feed upon phytoplankton and increase in abundance following nutrient enrichment. In combination with other factors an aggregation of feeding starfish may result (see adult distribution). However, an excess of nutrients (eutrophication) facilitating a high pelagic production, in combination with thermal stratification of the water column during summer is likely to cause hypoxia and starfish mortality (see oxygenation) (Josefson & Rosenberg, 1988; Rosenberg & Loo, 1988, Rosenberg et al., 1992). Extensive mortality of benthic populations including Asterias rubens was reported by Bokn et al., (1990) in response to hypoxic conditions caused by a toxic algal bloom of Chrysochromulina polylepsis along the Norwegian coast. However, these adverse effects are indirect and are only likely to occur in extreme situations. Intolerance directly to increased nutrient levels is assessed as low. | Low |
Henricia oculata (Bloody Henry starfish) | S | Henricia oculata frequently suspension feeds, increased siltation may clog or interfere with this mechanism requiring extra energy expenditure to clear the feeding apparatus. Recovery occurs once feeding is no longer impaired, energy expenditure is returned to normal and condition is restored. | Very low |
HM | Insufficient information | Insufficient information | |
H | Insufficient information | Insufficient information | |
N | Insufficient information | Insufficient information | |
Osilinus lineatus (Thick top shell) | S | Deposition of suspended sediment may cause siltation of nursery areas, removing required habitat including nooks and crevices and prevent juveniles from settling and surviving. Recruitment failure may result from a chronic deposition over a year or an acute episode coinciding with the peak juvenile settlement season in autumn (see smothering above). Overall, an intolerance of intermediate has been recorded. Recoverability is likely to be high. | Low |
HM | Insufficient information | Insufficient information | |
H | Adult Osilinus lineatus were seen to decline further in Milford Haven after the Sea Empress oil spill in 1996 (Little, 1999). | Low | |
N | It is unlikely that changes in nutrient levels will have a large effect on this species. Increase in the nutrient load of the water may lead to an increase in the microalgal food source. It has been suggested that toxic algal blooms may adversely affect this species but no direct evidence of this has been found. | Low | |
Fucus vesiculosus (Bladder wrack) | S | Siltation may cover some of the fronds and so reduce light available for photosynthesis and lower growth rates. Once silt is removed the growth rate should rapidly recover. | Not sensitive |
HM | Fucoids accumulate heavy metals and may be used as indicators to monitor these. It is generally accepted that adult plants are relatively tolerant of heavy metal pollution (Holt et al., 1997). However, local variation exists in the tolerance to copper. Plants from highly copper polluted areas can be very tolerant, while those from unpolluted areas suffer significantly reduced growth rates at 25 micrograms per litre. | Low | |
H | Fucus vesiculosus shows limited intolerance to oil. After the Amoco Cadiz oil spill it was observed that Fucus vesiculosus suffered very little (Floc'h & Diouris, 1980). Indeed, Fucus vesiculosus, may increase significantly in abundance on a shore where grazing gastropods have been killed by oil. However, very heavy fouling could reduce light available for photosynthesis and in Norway a heavy oil spill reduced fucoid cover. Recovery occurred within two years in moderately exposed conditions and four years in shelter (Holt et al., 1997). | Low | |
N | Nutrients are essential for algal growth and are often a limiting factor. When plants grow in high densities they are usually competing for nutrients. Increased nutrients may lead to eutrophication, overgrowth by green algae and reduced oxygen levels. However, fucoids appear relatively resistant to sewage and they grow within 20m of an outfall discharging sewage from the Isle of Man (Holt et al., 1997). | Low | |
Ecological Receptor | Environmental Change Factor & Sensitivity Details | Sensitivity | |
Fucus serratus (Toothed or serrated wrack) | S | Siltation will only have an effect during the time that the seaweed is covered with water. Increased siltation may cover the frond surface with a layer of sediment reducing photosynthesis and growth rate. Once conditions return to 'normal' then it probably won't take long for the population to resume a normal size and growth rate. | Very low |
HM | Fucoid algae readily accumulate heavy metals within their tissues. The effect of heavy metals on the growth rate of adult Fucus serratus plants has been studied by Stromgren (1979b;1980a & b). Copper significantly reduces the growth rate of vegetative apices at 25 µg/l over 10 days (Stromgren, 1979b). Zinc, lead, cadmium & mercury significantly reduce growth rate at 1400 µg/l , 810ug/l, 450ug/l and 5ug/l respectively (Stromgren, 1980a & b). The benchmark concentrations of heavy metals may therefore reduce growth rate, so intolerance is reported as low, although early life stages of the species may be more intolerant. | Low | |
H | Adult plants are tolerant of exposure to spills of crude oil although very young germlings are intolerant of relatively low concentrations of 'water soluble' extractions of crude oils. Exposure of eggs to these extractions (at 1.5 micrograms/ml for 96 hours) interferes with adhesion during settling) and (at 0.1micrograms/ml) prevents further development (Johnston, 1977). Fucus serratus is highly fecund, is iteroparous, surviving and breeding for protracted periods over 3-4 years. The eggs are broadcast into the water column allowing a potentially large dispersal distance. The species is found on all British and Irish coasts so there are few mechanisms isolating populations. Recruitment may occur through reproduction of the remaining population or from other populations. As some of the population remains it is unlikely that other species will come to dominate. Removal of some of the adult canopy will allow the understorey germling back to grow faster. Recovery will probably have occurred after a year. | Low | |
N | When in high densities, the seaweed competes for space light and nutrients. Nutrient availability is the most important factor controlling germling growth. Plants under low nutrient regimes achieve smaller sizes and may be out competed. Fucus serratus is highly fecund, is iteroparous, surviving and breeding for protracted periods over 3-4 years. The eggs are broadcast into the water column allowing a potentially large dispersal distance. The species is found on all British and Irish coasts so there are few mechanisms isolating populations. Recruitment may occur through reproduction of the remaining population of from other populations. As some of the population remains it is unlikely that other species will come to dominate. Removal of some of the adult canopy will allow the understorey germling back to grow faster. Recovery will probably have occurred after a year. | Low | |
![]() Capita Symonds Ltd
Capita Symonds Ltd
Capita Symonds House Wood Street
East Grinstead
West Sussex RH19 1UU
Tel +44 (0)1342 327161
Fax +44 (0)1342 315 927 www.capitasymonds.com