The official version of this document can be found via the PDF button.
The below content has been automatically generated from the original PDF and some formatting may have been lost, therefore it should not be relied upon to extract citations or propose amendments.


 ESTIMATED INORGANIC NUTRIENT LOADING


 U
U


 TO INTERTIDAL REGIONS FROM
  CATCHMENT


 NIEVAESRTS ITY


 AND WASTE WATER
  SOURCES AND THE


 OF
OF
![]()
![]()
![]()
![]()
![]()
![]()
![]()
![]()
![]()
![]()
![]()
![]()
![]()
![]()
![]()
![]()
![]()
![]()
![]()
![]()
![]()
![]()
![]()
![]()
![]()
![]()
![]()
![]()
![]()
![]()
![]()
![]()
![]()
![]()
![]()
![]()
![]()
![]()
![]()
![]()
![]()
![]()
![]()
![]()
![]()
![]()
![]()
![]()
![]()
![]()
![]()
![]()
![]()
![]()
![]()
![]()
![]()
![]()
![]()
![]()
![]()
![]()
![]()
![]()
![]()
![]()
![]()
![]()
![]()
![]()
![]()
![]()
![]()
![]()
![]()
![]()
![]()
![]()
![]()
![]()
![]()
![]()
![]()
![]()
![]()
![]()
![]()
![]()
![]()
![]()
![]()
![]()
![]()
![]()
![]()
![]()
![]()
![]()
![]()
![]()
![]()
![]()
![]()
![]()
![]()
![]()
![]()
![]()
![]()
![]()
![]()
![]()
![]()
![]()
![]()
![]()
![]()
![]()
![]()
![]()
![]()
![]()
![]()
![]()
![]()
![]()
![]()
![]()
![]()
![]()
![]()
![]()
![]()
![]()
![]()
![]()
![]()
![]()
![]()
![]()
![]()
![]()
![]()
![]()
![]()
![]()
![]()
![]()
![]()
![]()
![]()
![]()
![]()
![]()
![]()
![]()
![]()
![]()
![]()
![]()
![]()
![]()
![]()
![]()
![]()
![]()
![]()
![]()
![]()
![]()
![]()
![]()
![]()
![]()
![]()
![]()
![]()
![]()
![]()
![]()
![]()
![]()
![]()
![]()
![]()
![]()
![]()
![]()
![]()
![]()
![]()
![]()
![]()
![]()
![]()
![]()
![]()
![]()
![]()
![]()
![]()
![]()
![]()
![]()
![]()
![]()
![]()
![]()
![]()
![]()
![]()
![]()
![]()
![]()
![]()
![]()
![]()
![]()
![]()
![]()
![]()
![]()
![]()
![]()
![]()
![]()
![]()
![]()
![]()
![]()
![]()
![]()
![]()
![]()
![]()
![]()
![]()
![]()
![]()
![]()
![]()
![]()
![]()
![]()
![]()
![]()
![]()
![]()
![]()
![]()
![]()
![]()
![]()
![]()
![]()
![]()
![]()
![]()
![]()
![]()
![]()
![]()
![]()
![]()
![]()
![]()
![]()
![]()
![]()
![]()
![]()
![]()
![]()
![]()
![]()
![]()
![]()
![]()
![]()
![]()
![]()
![]()
![]()
![]()
![]()
![]()
![]()
![]()
![]()
![]()
![]()
![]()
![]()
![]()
![]()
![]()
![]()
![]()
![]()
![]()
![]()
![]()
![]()
![]()
![]()
![]()
![]()
![]()
![]()
![]()
![]()
![]()
![]()
![]()
![]()
![]()
![]()
![]()
![]()
![]()
![]()
![]()
![]()
![]()
![]()
![]()
![]()
![]()
![]()
![]()
![]()
![]()
![]()
![]()
![]()
![]()
![]()
![]()
![]()
![]()
![]()
![]()
![]()
![]()
![]()
![]()
![]()
![]()
![]()
![]()
![]()
![]()
![]()
![]()
![]()
![]()
![]()
![]()
![]()
![]()
![]()
![]()
![]()
![]()
![]()
![]()
![]()
![]()
![]()
![]()
![]()
![]()
![]()
![]()
![]()
![]()
![]()
![]()
![]()
![]()
![]()
![]()
![]()
![]()
![]()
![]()
![]()
![]()
![]()
![]()
![]()
![]()
![]()
![]()
![]()
![]()
![]()
![]()
![]()
![]()
![]()
![]()
![]()
![]()
![]()
![]()
![]()
![]()
![]()
![]()
![]()
![]()
![]()
![]()
![]()
![]()
![]()
![]()
![]()
![]()
![]()
![]()
![]() OBSERVED EFFECTS ON MARINE BENTHIC
OBSERVED EFFECTS ON MARINE BENTHIC


 ANGLIA


 MACRO-ALGAE
 IN JERSEY, CHANNEL


 ISLANDS


![]()
![]()
![]()
![]()
![]()
![]()
![]()
![]()
![]()
![]()
![]()
![]()
![]()
![]()
![]()
![]()
![]()
![]()
![]()
![]()
![]()
![]()
![]()
![]()
![]()
![]()
![]()
![]()
![]()
![]()
![]()
![]()
![]()
![]()
![]()
![]()
![]()
![]()
![]()
![]()
![]()
![]()
![]()
![]()
![]()
![]()
![]()
![]()
![]()
![]()
![]()
![]()
![]()
![]()
![]()
![]()
![]()
![]()
![]()
![]()
![]()
![]()
![]()
![]()
![]()
![]()
![]()
![]()
![]()
![]()
![]()
![]()
![]()
![]()
![]()
![]()
![]()
![]()
![]()
![]()
![]()
![]()
![]()
![]()
![]()
![]()
![]()
![]()
![]()
![]()
![]()
![]()
![]()
![]()
![]()
![]()
![]()
![]()
![]()
![]()
![]()
![]()
![]()
![]()
![]()
![]()
![]()
![]()
![]()
![]()
![]()
![]()
![]()
![]()
![]()
![]()
![]()
![]()
![]()
![]()
![]()
![]()
![]()
![]()
![]()
![]()
![]()
![]()
![]()
![]()
![]()
![]()
![]()
![]()
![]()
![]()
![]()
![]()
![]()
![]()
![]() BY E.R. HOLMES
BY E.R. HOLMES
Dissertation presented in part-fulfilment of Bachelor of Science in accordance with the regulations of the University of East Anglia
School of Environmental Sciences University of East Anglia University Plain
Norwich UK
NR4 7TJ
© 2010 ER Holmes
This copy of the dissertation has been supplied on condition that anyone who consults it is understood to recognise that its copyright rests with the author and that no quotation from the dissertation, nor any information derived therefrom, may be published without the author's prior written consent. Moreover, it is supplied on the understanding that it represents an internal University document and that neither the University nor the author are responsible for the factual or interpretative correctness of the dissertation.
ABSTRACT
Increasingly high nutrient inputs from the intensification of agriculture and larger wastewater sources have led to changes in the diversity of macro-algal populations in inter-tidal regions of the French coast.
This study considers the effects of nutrient loading from catchment and wastewater sources on the marine benthic macro-algal populations of two bays in the Island of Jersey, Channel Islands.
Loadings for dissolved available inorganic nitrogen (DAIN) and dissolved available inorganic phosphorus (DAIP) were found to be a magnitude higher for St. Aubin's Bay than for St. Ouën's Bay, with the Jersey Wastewater Treatment Works accounting for 62% of the DAIN and 93% of the DAIP loadings.
Macro-algal populations of St. Aubin's Bay received higher levels of nutrients due to the contributions from the WwTW. This led to a reduction in the diversity of the population with higher levels of opportunistic algae such as Ulva Spp. and Enteromorpha Spp. This may explain why the ecological quality ratio of St. Aubin's was found to be classified as BAD-POOR'. These populations are considered a biological quality element' under the Water Framework Directive (WFD) and reflect the general quality of the marine environment.
![]() The findings of this study suggest that the current nutrient loadings from the Jersey WwTW are adversely affecting the macro-algal populations and consequently the eco- system as a whole. Thus the current proposals to reduce the nutrient load from the WwTW are considered necessary, despite the financial implications. The limitations of this study are clear, however, and options for further research are discussed, as well as management solutions.
The findings of this study suggest that the current nutrient loadings from the Jersey WwTW are adversely affecting the macro-algal populations and consequently the eco- system as a whole. Thus the current proposals to reduce the nutrient load from the WwTW are considered necessary, despite the financial implications. The limitations of this study are clear, however, and options for further research are discussed, as well as management solutions.
Keywords: macro-algae, coastal eutrophication, nutrient budgets, catchment, wastewater treatment works, Jersey Channel Islands
- INTRODUCTION ........................................................................................................ 5
- BACKGROUND......................................................................................................... 6
- The Study System ................................................................................................. 6
- St. Aubin's Bay ...................................................................................................... 7
- St. Ouën's Bay ...................................................................................................... 8
- Sources of nutrient loading into coastal waters...................................................... 8
- Inputs from catchment sources ............................................................................. 9
- Inputs from the Wastewater Treatment Works ...................................................... 9
- The impact of nutrient loading on coastal environments ...................................... 10
- METHODOLOGY ..................................................................................................... 14
- Water Quality ....................................................................................................... 14
- Sample collection, storage and analysis ............................................................. 14
- Hydrology and budget calculations ..................................................................... 15
- Phycological field methods to evaluate macro-algae populations ........................ 15
- Ecological parameters......................................................................................... 15
- Assessing populations of rock abrasion platforms .............................................. 16
- Assessing the growth of pioneer species ............................................................ 17
- RESULTS AND ANALYSIS ........................................................................................ 20
- Water Quality: General survey ............................................................................. 20
- Nutrient loading ................................................................................................... 22
- The diversity and abundance of the macro-algal populations of both bays ......... 24
- Macro-algal populations of the rock abrasion platforms ...................................... 24
- Growth of pioneer species on settling plates....................................................... 27
- DISCUSSION .......................................................................................................... 29
- CONCLUSIONS ...................................................................................................... 32
- RECOMMENDATIONS FOR FURTHER WORK ............................................................... 34 ACKNOWLEDGEMENTS ..................................................................................................... 35 BIBLIOGRAPHY ................................................................................................................ 36 APPENDICES ................................................................................................................... 41 APPENDIX 1 ..................................................................................................................... 42 APPENDIX 2 ..................................................................................................................... 45 Project Proposal ............................................................................................................ 45 APPENDIX 3 ..................................................................................................................... 49 Progress Report ............................................................................................................ 49
Table 1: Summary of DAIN concentrations (mgl-1) in catchment runoff (Cct) and Bellozanne WwTW effluent (Cs) inputs to St. Aubin's Bay and Cct into St. Ouën's Bay, Jersey (March 08 to September 09). A hyphen indicates that no reading was taken. ... 20
Table 2: Summary of DAIP concentrations (mgl-1) in catchment runoff (Cct) and Bellozanne WwTW effluent (Cs) inputs to St. Aubin's Bay and Cct into St. Ouën's Bay, Jersey (March 08 to September 09). A hyphen indicates that no reading was taken. ... 20
Table 3: Summary of average monthly macro-nutrient loading (kg) and total volume (m3) in catchment runoff (Lct & Qct) and Bellozanne WwTW effluent (Ls & Qs) inputs to St. Aubin's Bay and St. Ouën's Bay, Jersey (March 08 to September 09) (*Qs taken from Stapleton et al., 2000) . ................................................................................................. 23
Table 4: Macro-algal taxa in order of population size for St. Aubin's Bay, surveyed in September 2009. P= Population size, C= %age cover, op= opportunistic..................... 26
Table 5: Macro-algal taxa in order of population size for St. Ouën's Bay, surveyed in September 2009. P= Population size, C= %age cover, op= opportunistic..................... 27
Table 6: Summary of results for each parameter, taken from WFD UKTAG (2009a). ... 27
Table 7: Summary of results for Species richness (S), Simpson Index (D), Shannon Index (H'). ...................................................................................................................... 27
Table 8: Summary of results for dissimilarity tests; Jaccard Distance (J'), Bray-curtis Distance (BCij). .............................................................................................................. 27
Table 9: Summary of macro-algal growth on settling plates in St. Aubin's Bay and St. Ouën's Bay, Jersey. ...................................................................................................... 28
List of Figures
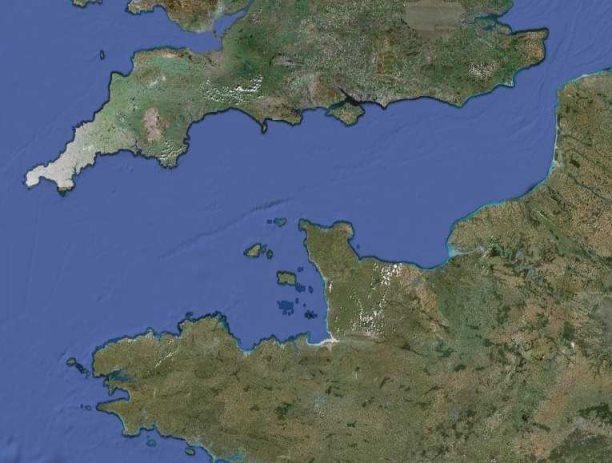
Figure 1: Satellite image of the Channel Islands in relation to the coasts of France and the UK © Google maps, 2009 .......................................................................................... 6
Figure 2: The topography of Jersey with place names, adapted from Robins and Smedley (1998) ............................................................................................................... 7
Figure 3: Macro-algal bloom washed ashore, covering the middle section of St. Aubin's Bay, Jersey .................................................................................................................... 10
Figure 4: Catchment areas (km2) draining into St. Aubin's Bay, Jersey, (Les Quennevais watercourse - blue catchment, St. Peter 's Valley & Beaumont Valley - yellow catchment, Waterworks Valley - green catchment) and some of hydrological and chemical sampling points used to calculate discharge estimates and nutrient concentrations. ................... 12
Figure 5: Catchment areas (km2) draining into St. Ouën's Bay, Jersey, (La Pulente, Val de la Mare & St.Ouën's Valley – pink catchment) and some of hydrological and chemical sampling points used to calculate discharge estimates and nutrient concentrations. .............................................................................................................. 13
Figure 6: Rock abrasion platforms and the locations of settling plates in St. Ouën's Bay, Jersey. L'Etacq rock abrasion platform (grey) and corresponding settling plate location (blue circle), La Pulente rock abrasion platform (brown) and corresponding settling plate location (blue circle). ...................................................................................................... 18
Figure 7: Rock abrasion platforms and the locations of settling plates in St. Aubin's Bay, Jersey. St. Aubin's Fort rock abrasion platform (grey) and corresponding settling plate location (blue circle), Elizabeth Castle rock abrasion platform (brown) and corresponding settling plate location (blue circle). ......................................................... 19
Figure 8: Dissolved available inorganic nitrogen (DAIN) and dissolved available inorganic phosphorus (DAIP) concentrations (mgl-1) in catchment streams (C ) and
ct Bellozanne WwTW final effluent (Cs) draining into St. Aubin's Bay, Jersey. .................. 21
Figure 9: Dissolved available inorganic nitrogen (DAIN) and dissolved available inorganic phosphorus (DAIP) concentrations (mgl-1) in catchment streams (C ) draining
ct
into St. Ouën's Bay, Jersey. .......................................................................................... 21
Figure 10: Monthly DAIN and DAIP loading (kg) (average of sampling seasons) from catchment streams (Lc) (defined by dashed outline) and WwTW (Ls) draining into St. Aubin's and St. Ouën's Bay, Jersey............................................................................... 23
Figure 11: Macro-algal populations of St. Aubin's Bay at a) Elizabeth Castle, b) St. Aubin's Fort, and St. Ouën's Bay at c) La Pulante, d) L'Etacq, surveyed in September 2009. (Rounding errors may mean that totals do not equal 100%.)............................... 25
Figure 12: Macro-algal populations of settling plates in St. Aubin's Bay at a) Elizabeth Castle, b) St. Aubin's Fort and St. Ouën's Bay at c) La Pulante, d) L'Etacq. ................. 28
Figure 13: St. Aubin's Fort rock abrasion platform (West of St. Aubin's Bay) ................ 42 Figure 14: Elizabeth Castle rock abrasion platform (East of St. Aubin's Bay)................ 42 Figure 15: L'Etacq rock abrasion platform (North of St. Ouën's Bay) ............................ 43 Figure 16: La Pulente rock abrasion platform (South of St. Ouën's Bay) ...................... 43
Figure 17: Photo of quadrat and macro-algal population, taken as part of the survey of L'Etacq rock abrasion platform in St. Ouën's Bay. Species are predominantly ESG1 such as Fucus sp. and Coralina officinalis. .................................................................... 44
Figure 18: Photo of quadrat and macro-algal population, taken as part of the survey of Elizabeth Castle rock abrasion platform in St. Aubin's Bay. Species are predominantly ESG2 such as Ulva sp. and Enteromorpha sp. ............................................................. 44
- INTRODUCTION
Intensive agricultural practices, using artificial and urea-based fertilizers, have been shown to increase inputs of nutrient substances into aquatic and marine environments (Foster et al. 1989). In a process known as eutrophication, macro-nutrients such as nitrate and phosphate leach from arable soils, causing changes in the nutrient balance and increasing the nutritional status of aquatic environments. Eutrophication can be identified by superabundant algal production often followed by a drop in dissolved oxygen levels prejudicial to fauna, and a modification of the algal biodiversity in the inter-tidal zone (Nixon, 1995; Richardson & Jorgensen, 1996).
The EC Water Framework Directive (WFD) states that macro-algae are a biological quality element' that can be used to define the ecological status of a coastal water body. Intertidal macro-algae communities respond to changes in nutrient status and problems of eutrophication, toxic substances, and habitat modification (Fletcher, 1996). The prevalence of macro-algal blooms is increasing in many coastal areas and is linked to areas of intensive agriculture (Richardson & Jorgensen, 1996; Wells et al., 2007). Indeed the accumulation of masses of Ulva sp. on open beaches of the Brittany coast of France have been attributed to freshwater input of nitrate, extensive, gently sloping, tidal sand flats and weak residual tidal circulation (Piriou et al., 1991).
The Channel Islands are generally little affected by the phenomena of coastal eutrophication due to the tidal currents in the English Channel. However there are some isolated cases of disturbed sites, displaying a proliferation of green macro-algae, such as St. Aubin's Bay on the Island of Jersey (Stapleton et al., 2000).
This study aims to answer four main research questions:
- Are there differences in the loadings of dissolved available inorganic nitrogen (DAIN) and dissolved available inorganic phosphorus (DAIP) from catchment sources (watercourses) into St. Ouën's Bay and St. Aubin's Bay?
- Does the discharge from the Wastewater Treatment Works (WwTW) out-falling into St. Aubin's Bay considerably affect the total nutrient input into coastal waters?
- What are the current conditions of the macro-algal populations of St. Ouën's Bay and St. Aubin's Bay?
- Can any observed changes in the biodiversity of benthic marine macro-algae found in either baybe attributed to the nutrient loadings from either catchment or wastewater sources?
- BACKGROUND
- The Study System
Situated in the Gulf of St. Malo near the French coast, the island of Jersey is the largest of the Channel Islands (Figure 1). Jersey has a land area of 117km2 and comprises of a
plateau with an elevation of between 60-120m above sea level with a steep topographic rise along the coastline (Robins & Smedley, 1994; Green et al., 1998). The plateau is divided by a series of north-to-south incised valleys, mostly draining the higher ground in the north to discharge along the south coast (Figure 2). From west to east the principal valleys are St. Peter, Waterworks, Les Grand Vaux and Queen's. The west coast includes the wide sands of St. Ouën's Bay (La Baie de St Ouën) and the south coast is dominated by St. Aubin's Bay (La Baie de la Ville). The highest ground is situated adjacent to the north coast – between the parishes of St. John and Trinity the elevation exceeds 130m above datum. Spring tides (higher than normal tidal range) may attain a range up to 12m; during these periods larger areas of the intertidal beach are exposed, thereby allowing greater areas of habitat to be surveyed.
 UNITED KINGDOM
CHANNEL ISLANDS
Jersey
Saint Malo
FRANCE
Figure 1: Satellite image of the Channel Islands in relation to the coasts of France and the UK © Google maps, 2009
The climate is temperate maritime, with an average annual rainfall (1980 to 2009) during the macro-algae season (May to September) of 263.9mm at Jersey Airport (West) and 262.2mm at the Maison St Louis Observatory (East). The rainfall in 2009 during this season was significantly lower than the 30-year mean (<0.05%) at both the Airport and Maison St. Louis (205.5mm and 178.2mm respectively). Spatially, there is significantly less rainfall in the west and southwest of the island than in the east (Wyer & Kay, 2009). Mean annual temperature is 11.5°C, average sea temperature is 12.3°C, and relative humidity varies from 75% in early summer to 85% in the winter months. Mean annual potential transpiration lies in the range 648 to 754mm. Prevailing winds are westerly and south-westerly and occasionally north-westerly (Robins et al., 1993).
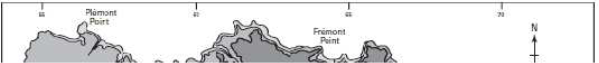
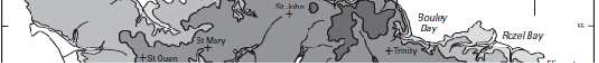
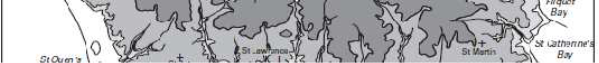
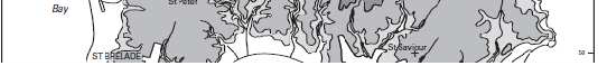
Figure 2: The topography of Jersey with place names, adapted from Robins and Smedley (1998)
- St. Aubin's Bay
St Aubin's Bay dominates the south coast of Jersey and is bounded by cliff-lined bays in the west, (Noirmont Point) and the town harbour in the east, acting as an artificial end point separating St. Aubin's bay from Le Havre des Pas Beach (Figure 2).
The inter-tidal beach consists of a western rock abrasion platform (Noirmont/St. Aubin's Fort) (see Figure 13 in Appendix 1) consisting of Jersey Shale formation and the eroded granites of the Southeast Igneous Complex, a central section of sand and shingle and a southeast rock abrasion platform (Elizabeth Castle) (see Figure 14 in Appendix 1) extending 2km fringing the coast. The Elizabeth Castle platform consists of many gullies cut into eroded granites and diorites and is part of a Southeast Igneous Complex (Bishop & Bisson, 1989; Helm, 1984; Robins & Smedley, 1998).
St. Aubin's Bay is a macro-tidal environment which experiences semi-diurnal tides with a mean spring tidal range of 9.6 m, reducing to 4 m at neap tides (Kitson, 2002). The bay is sheltered from the majority of the energy from the Atlantic as a result of its position in the south of the island (Gunton, 1997).
- St. Ouën's Bay
St. Ouën's Bay is relatively flat (gradients range from 1:100 to 1:30) and wide (inter-tidal beach widths range from 250 to 500m) with a 7km stretch of shoreline in the west of Jersey (Cooper & Pethick, 2005). The bay is also bounded by rock headlands (South: Corbiere Point, North: Grosnez Point) (Figure 2). The inter-tidal beach consists of a northern rock abrasion platform (L'Etacq) (see Figure 15 in Appendix 1), a central section of sand and shingle and a southern rock abrasion platform (La Pulente) (see Figure 16 in Appendix 1) (ibid).
The L'Etacq platform comprises as part of the Jersey Shale formation and extends offshore westwards to the Rigdon bank. The various lithologies, structural attitude of the beds, the plunging folds, and the fault lines are well exposed, the latter gullies varying in width and depth. The La Pulente platform comprises of the eroded Southwest Igneous Complex, including coarse granite intruded by dolerite and aplite dykes (Bishop & Bisson, 1989; Helm, 1984; Robins & Smedley, 1998). The geology of both platforms provides many sub-habitats (rock pools, crevices) for macro-algae.
St. Ouën's Bay experiences semi-diurnal tides with a spring tidal range greater than 10m. It is a high energy, macro-tidal environment, which experiences contrasting beach morphology between storm and non-storm conditions, with the centre of the Bay predominantly exposed to Atlantic storm waves with considerable fetch (Cooper & Pethick, 2005; Shepard & Lafond, 1940, Dubois, 1988, citied in Gunton, 1997).
- Sources of nutrient loading into coastal waters
There are many sources of inorganic and organic nutrients, including catchment inputs, inputs from the Wastewater Treatment Works (WwTW), atmospheric deposition, plant and animal decomposition, animal excretion and oceanic mixing processes (GESAMP, 1990). Only the inputs from the catchments and the Wastewater Treatment Works are considered in this study. The other sources would require complex measurements; therefore, as a result of time and resource constraints, these were not quantified.
- Inputs from catchment sources
The temperate maritime climate, as described in Section 2.1, has encouraged extensive agriculture on Jersey. Jersey agriculture has also experienced many changes in the last few decades, including concentration (fewer, larger farms), specialisation (less diverse crop rotations) and intensification (Foster et al., 1989).
The quality of watercourses reflects the land utilization and farm management in the surrounding catchment areas (ibid). During winter and early spring, applications of nitrogen fertilizer to early-cropping potatoes and horticultural crops lead to nutrient leaching, with estimates of leaching losses of up to 100kg nitrogen per hectare for potato crops (Robins et al., 1993; Green et al., 1998). As Jersey is not a member state of the European Commission (EC), water quality standards such as those contained in the Water Framework Directive (WFD) are not enforceable. Nutrient loading from catchment sources has the potential to increase the nutrient levels significantly in receiving coastal waters, affecting the marine ecosystems there. Catchments included in this study are illustrated in Figure 4 and Figure 5.
- Inputs from the Wastewater Treatment Works
This study will also take into consideration the contribution of the Bellozanne Wastewater Treatment Works (WwTW or Sewage Treatment Works), as a potential source of nutrient loading into coastal waters. It is located within the Bellozanne catchment; the outflow of the ultraviolet (UV) disinfection plant outfalls into the southeast end of St. Aubin's Bay.
In 1997 the WwTW accounted for 54% of the inorganic nitrogen load and 98% of the inorganic phosphorus load into St. Aubin's Bay (Stapleton et al., 2000). Suggestions were made for the installation of nutrient removal technology to reduce these figures. Upgrading of the WwTW was undertaken in light of these findings and finished in 2002, but failed to meet the agreed nitrogen output levels. As of 2009 the WwTW is failing its discharge permit (reference number DC2000/07/01) under the Water Pollution Law, 2000 (Jersey), which requires an annual average concentration of less than 10mg/l total
nitrogen and 35mg/l suspended solids (on a 95 percentile basis) (States of Jersey, 2009). A decision was made by the States of Jersey on the 11th December 2009 to
start works that will enhance the performance of the WwTW by reducing nitrogen inputs into receiving waters. The estimated total cost of these improvements will be £1,545,000, highlighting the significance of the issue (States of Jersey, 2009). Before improvements are made the WwTW will continue to discharge high nutrient loads and may affect the macro-algal community. It is therefore important the WwTW loadings are added to those from catchment sources in this study.
- The impact of nutrient loading on coastal environments
Increased nutrient concentration in coastal waters and associated macro-algae and phytoplankton production can be caused by high inorganic nutrient fluxes from agricultural runoff or human sewage discharge. Such conditions are often associated with relatively shallow water and weak residual tidal circulation (Piriou, et al., 1991; Fletcher, 1996). Anoxic events resulting from eutrophication impede the growth of sea grasses and slow-growing macro-algae (Duarte, 1995; Nixon, 1995; Cloern, 2001). Indeed, the increasing dominance of opportunistic green macro-algae in shallow sub- littoral locations as a result of increased nutrient loading (particularly nitrogen and phosphorus) is well documented (Fletcher, 1996; Valiela et al., 1997; Raffaelli et al., 1998; Cloern 2001; Bricker et al., 2003). During the summer, St. Aubin's Bay experiences the proliferation of opportunistic green macro-algae, particularly Ulva spp. (Stapleton et al., 2000) (Figure 3).
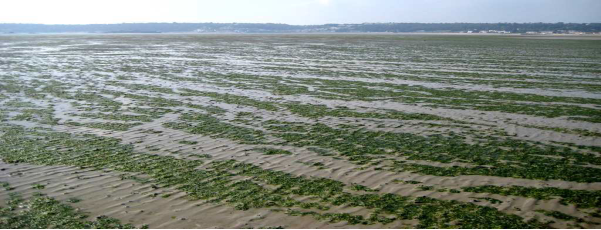
Figure 3: Macro-algal bloom washed ashore, covering the middle section of St. Aubin's Bay, Jersey
These species are physiologically resilient to stress from wide-ranging light and salinity, and can tolerate fluctuating high temperatures associated with shallow water environments (Raffaelli et al., 1998; Schramm, 1999). For example, U. lactuca has a large surface area per unit volume, therefore nutrients can be taken up 4-6 times faster than slower growing perennial species, allowing it to produce new biomass faster (Pedersen & Borum, 1997; Raffaelli et al., 1998; Altamirano et al., 2000). However, growth is often limited by the availability of suitable substrate (Raffaelli et al., 1998), such as the rock abrasion platforms in St. Aubin's and St. Ouën's Bay (see Section 2.1).
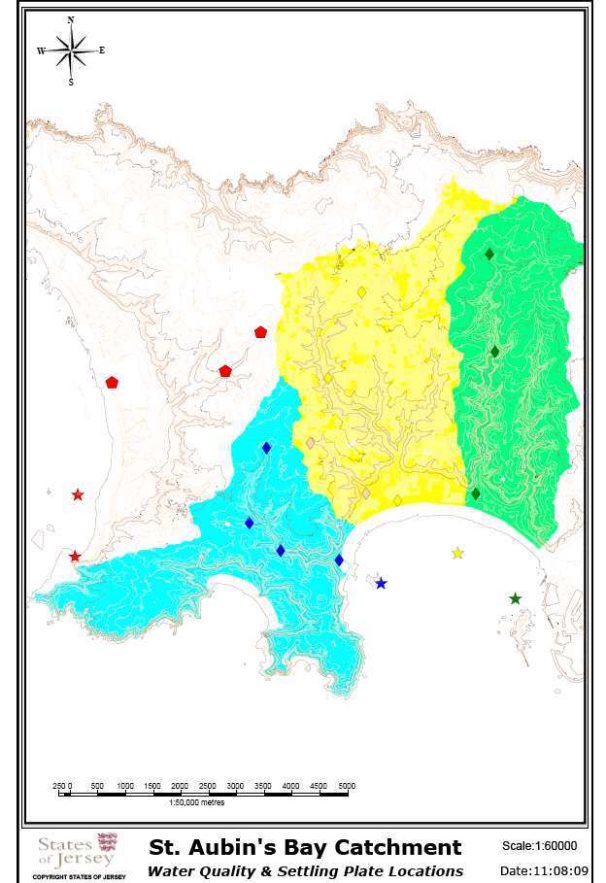
Figure 4: Catchment areas (km2) draining into St. Aubin's Bay, Jersey, (Les Quennevais watercourse - blue catchment, St. Peter 's Valley & Beaumont Valley - yellow catchment, Waterworks Valley - green catchment) and some of hydrological and chemical sampling points used to calculate discharge estimates and nutrient concentrations.
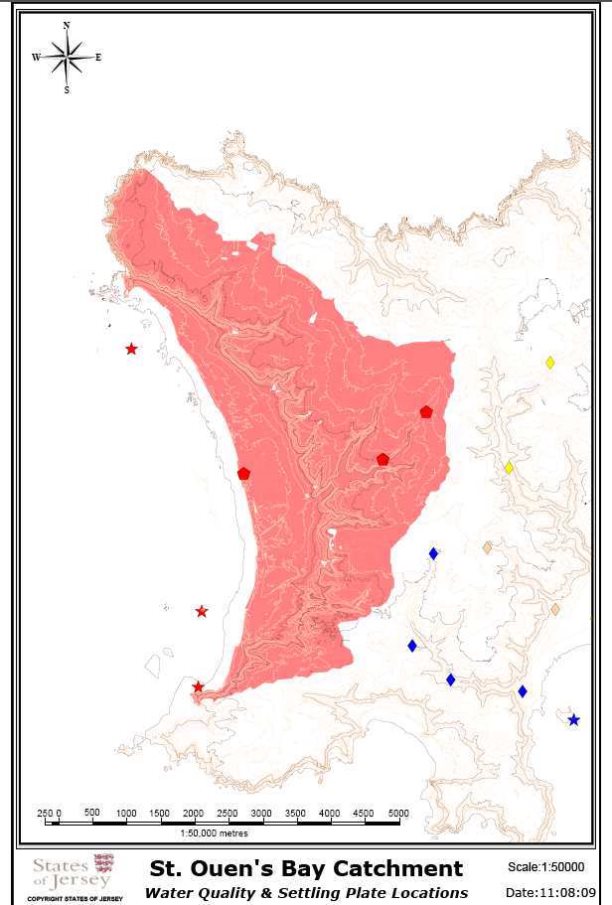
Figure 5: Catchment areas (km2) draining into St. Ouën's Bay, Jersey, (La Pulente, Val de la Mare & St.Ouën's Valley – pink catchment) and some of hydrological and chemical sampling points used to calculate discharge estimates and nutrient concentrations.
- METHODOLOGY
- Water Quality
- Sample collection, storage and analysis
The study assessed concentrations of dissolved available inorganic nitrogen (DAIN, represented by NO3 –N + NO2 –N + NH4 –N) and dissolved available inorganic phosphorus (DAIP, represented by soluble orthophosphate phosphorus). Concentrations were measured (Source, Mid-way, Outfall) between March 2008 and September 2009 for three streams within the single catchment draining into St. Ouën's Bay (La Pulante, Val de la Mare, St. Ouën's Valley-L'Etacq) and four streams in their corresponding catchments draining into St. Aubin's Bay (Les Quennevais, Beaumont Valley, St. Peter's Valley, Waterworks Valley). The survey period was chosen to encompass the macro-algae growing season.
Concentrations of DAIN and DAIP in the final effluent from the wastewater treatment works (WwTW) were examined in samples from the outflow of the ultraviolet (UV) disinfection plant (i.e. WwTW final effluent). It was not possible to monitor the outlet of the largest catchment, Grands Vaux, because of the construction of a marina at its discharge point. A complete set of water quality samples was not able to be collected for all sites because of access restrictions; for example, no samples were possible in the Bellozanne Valley catchment. Estimates for nutrient loading from these catchments have not been made in this study so will be taken into consideration whilst drawing conclusions.
Samples were collected during three seasons: March 2008, September 2008 and September 2009. On each occasion, samples were filtered through 45µm disposable filters into 128ml sterile plastic containers and immediately placed in dark cool boxes for transportation. Filtration removes larger particles that might produce turbidity and interfere with nutrient analysis as well as larger microorganisms, which could remove significant quantities of nutrients if the samples are not analyzed immediately (Littler & Littler, 1985). As soon as possible after collection, and always within three hours, samples were frozen before transportation to the University of East Anglia laboratory. Sample collection and treatment followed UK Environment Agency recommended clean sampling practices. The water samples were subsequently analysed on a segmented flow autoanalyzer (Skalar Continous Flow Analyzer) for DAIN and DAIP.
- Hydrology and budget calculations
For each stream outlet, flow rate was measured using a flow rate sensor, and volume was calculated from measurements of flow rate, channel width and depth of the water column. Total volume for each catchment (Qct) was then calculated. Catchment areas (km2) were digitised from 1:10,000 scale contour maps.
The DAIN and DAIP load from each catchment source is given by the product of the total volume and the nutrient concentration:
Lct = QctCct
where Qct = total volume from catchment (m3), Cct = concentration (kg/m3) and Lct = total load from catchment (kg) (Cct taken from watercourse outfall and Qct from outfall dimensions). The total monthly DAIN and DAIP loading from catchment sources were then calculated as:
Lc = Lct
Load from the WwTW (Ls) was calculated combining mean monthly flow (Qs) taken from Stapleton et al. (2000) and measured DAIN and DAIP concentrations (Cs):
Ls = QsCs
The monthly total load entering St. Aubin's and St. Ouën's Bay (Lt) can then be calculated using:
Lt = Lc + Ls
For St. Ouën's Bay, Ls = 0 as there is no WwTW outfall. The total DAIN and DAIP loads for the study period (March 2008, September 2008, September 2009) were obtained by calculating the sum of the monthly loads and averaging them (adapted from Stapleton et al., 2000).
- Phycological field methods to evaluate macro-algae populations
- Ecological parameters
In accordance with the requirements of Article 8, Section 1.3 of Annex II, and Annex V of the Water Framework Directive (2000/60/EC), WFD UKTAG (2009a) details a methodology to monitor, assess and classify coastal waters. Using an adapted version
of this methodology, the macro-algal populations of the two bays can be assessed. The
directive is designed to detect the impact on the quality element of general pressures, such as nutrients, toxic substances and disturbance.
The methodology uses aspects of community structure, such as ecological quality ratios, ecological status groups and the proportions of rhodophyta, chlorophyta and opportunist species.
An ecological quality ratio (EQR) for the macro-algal population is separated into several classes. In "natural" waters (HIGH), a high (but consistent) species richness would be expected, with a diverse community of red, green and brown seaweeds (NI EA, 2008). Cover varies depending on the physical conditions but species richness is relatively constant. In the HIGH status conditions, depending on physical factors, there is high proportion of long-lived spp. and few opportunists. In GOOD status conditions, there is a greater reduction in red spp. and greater proportion of short-lived spp. With further stress no more than 20 taxa are likely to be present (in MODERATE conditions), with greens and opportunists species being equal in number to long-lived and red species. Continuing stress sees the continuing reduction in taxa diversity with the continuing dominance of opportunistic, short –lived and green taxa (POOR-BAD) (ibid).
A lower ecological status group ratio (ESG) indicates a shift from a pristine state (EGS1– late successionals or perennials) to a degraded state (ESG2– opportunistic or annuals).
The Simpson index (D') and Shannon index (H') are used to calculate the diversity of the taxa. Other indices, such as Jaccard Distance (J') and Bray-curtis Distance (BCij'), are also used to calculate the dissimilarity between the sites in each bay. This was used to make an assessment of how homogenous the environment was.
- Assessing populations of rock abrasion platforms
For the purpose of estimating the parameters described in section 3.2.1, macro-algae, inhabiting hard, natural and tidally-influenced substrates (rock abrasion platforms), were identified for each catchment during September 2009, see Figure 6 and Figure 7.
A shore description was also recorded (methodology adapted from WFD UKTAG, 2009a). Two sampling areas located on the rock abrasion platforms in each bay were considered to be appropriate (bedrock substrate, including a range of sub-habitats) to obtain the range of algae needed for assessment (ibid). Sites were sampled during low water of a spring tide, in the lower littoral and sub-littoral zones. Sampling lasted approximately 30-45 minutes per site; this varied depending on the abundance and diversity of macro-algal species and the number of sub-habitats.
The sites were surveyed using a belt transect method and samples were recorded at 3m intervals along a transect 30m line (tape measure) laid across the intertidal area from the low water mark inland. A 1m2 quadrat was placed on the rock substrate every 3m along the transect. The macro-algae inside each quadrat were then identified and the percentage coverage for each species was estimated. A shore description was compiled, and particular attention was paid to large rock pools, deep pools, turfs in moist crevices and the sides of boulders or steep rocks and overhangs (ibid).
- Assessing the growth of pioneer species
Settling plates were used to monitor temporal changes in abundance and diversity of macro-algae species and pioneer species (including those considered invasive or opportunistic), and to measure any marine succession patterns. A settling plate is an artificial habitat for colonizing organisms that begin life as free-floating plankton, then settle out of the water column and attach themselves onto hard substrates (the settling plate).
The settling plates were made from tiling material with a granular surface coating to simulate the texture of the varying geology of the rock abrasion platforms (rather than plastic or wood). They were cut to a length of 0.26m and width of 0.16m, total surface area of 4.16m2 and a thickness of 0.01m. They were attached with narrow-gauge wire to large granite boulders for protection against wave impact and to prevent large moment. All plates were placed horizontally in pools, near the surface, therefore they were constantly underwater, to maximise to marine growth potential.
The settling plates were deployed for a period of 8th August 2009 to 19th September 2009. Settling plates were located within each of the rock abrasion platforms in both bays see Figure 6 and Figure 7. Colonising algae were identified and percentage coverage was recorded.
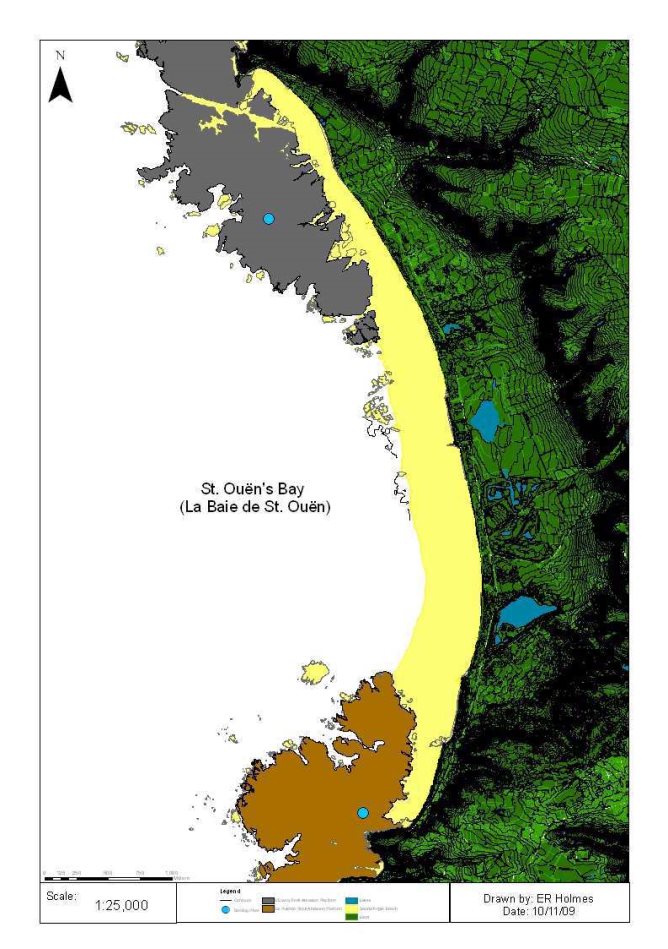 Figure 6: Rock abrasion platforms and the locations of settling plates in St. Ouën's Bay, Jersey. L'Etacq rock abrasion platform (grey) and corresponding settling plate location (blue circle), La Pulente rock abrasion platform (brown) and corresponding settling plate location (blue circle).
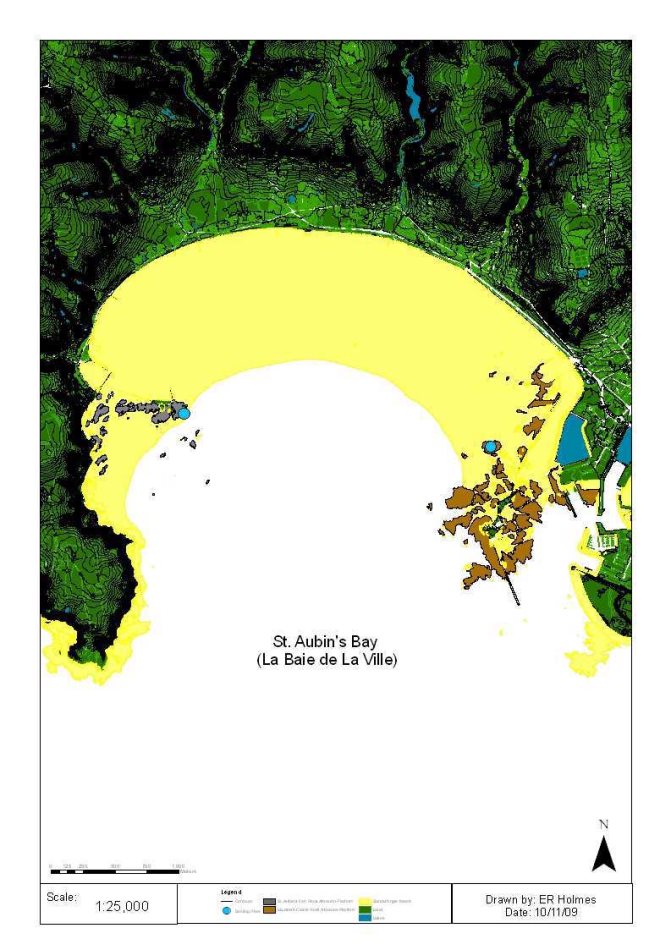
Figure 7: Rock abrasion platforms and the locations of settling plates in St. Aubin's Bay, Jersey. St. Aubin's Fort rock abrasion platform (grey) and corresponding settling plate location (blue circle), Elizabeth Castle rock abrasion platform (brown) and corresponding settling plate location (blue circle).
- RESULTS AND ANALYSIS
- Water Quality: General survey
The results of the surveys are shown in Figure 8 and Figure 9 and summarised in Table 1 and Table 2. Nitrogen was primarily in the form of NO - with NO and NH displaying
3 2 4 concentrations at least one magnitude less.
Concentrations of DAIN were greatest in the Beaumont Valley and St. Ouën's Valley catchments, with concentrations ranging between 6mgl-1 and 18mgl-1 within all
catchments (Table 1). DAIP concentrations were lower than DAIN in streams, ranging between 0.13mgl-1 and 0.96mgl-1. Most catchments had slightly higher concentrations in
September than March.
 Mar 2008 Sep 2008 Sep 2009 Average Catchment (mgl-1) (mgl-1) (mgl-1) (mgl-1)
St. Peter s Valley 11.6 10.6 9.0 10.4
Waterworks Valley 10.2 8.8 12.5 10.5
Les Quennevais 12.1 14.7 - 13.4 St. Aubin's
Beaumont Valley 16.2 17.7 - 16.9 Bay
Bellozane Valley - - -
Grands Vaux - - -
WwTW - - 25.7 25.7
La Pulente Outfall - - 5.5 5.5 St. Ouën's
Val de la Mare 13.4 12.5 0.0 8.6 Bay
St Ouëns Valley - - 17.3 17.3
Table 1: Summary of DAIN concentrations (mgl-1) in catchment runoff (Cct) and Bellozanne WwTW effluent (Cs) inputs to St. Aubin's Bay and Cct into St. Ouën's Bay, Jersey (March 08 to September 09). A hyphen indicates that no reading was taken.
 Mar 2008 Sep 2008 Sep 2009 Average Catchment (mgl-1) (mgl-1) (mgl-1) (mgl-1)
St. Peter s Valley 0.30 0.64 0.96 0.63
Waterworks Valley 0.13 0.20 0.27 0.20
Les Quennevais 0.23 0.20 - 0.21 St. Aubin's
Beaumont Valley 0.35 0.61 - 0.48 Bay
Bellozane Valley - - -
Grands Vaux - - -
WwTW - - 3.15 3.15
La Pulente Outfall - - 0.33 0.33 St. Ouën's
Val de la Mare 0.37 0.66 0.00 0.34 Bay
St Ouëns Valley - - 0.92 0.92
Table 2: Summary of DAIP concentrations (mgl-1) in catchment runoff (Cct) and Bellozanne WwTW effluent (Cs) inputs to St. Aubin's Bay and Cct into St. Ouën's Bay, Jersey (March 08 to September 09). A hyphen indicates that no reading was taken.
03/08 05/08 07/08 09/08 11/08 01/09 03/09 05/09 07/09 09/09
![]() DAIN St. Peter s Valley DAIN Waterworks Valley DAIN Les Quennevais DAIN Beaumont Valley
DAIN St. Peter s Valley DAIN Waterworks Valley DAIN Les Quennevais DAIN Beaumont Valley![]()
![]() DAIN WwTW DAIP St. Peter s Valley DAIP Waterworks Valley DAIP Les Quennevais DAIP Beaumont Valley DAIP WwTW
DAIN WwTW DAIP St. Peter s Valley DAIP Waterworks Valley DAIP Les Quennevais DAIP Beaumont Valley DAIP WwTW
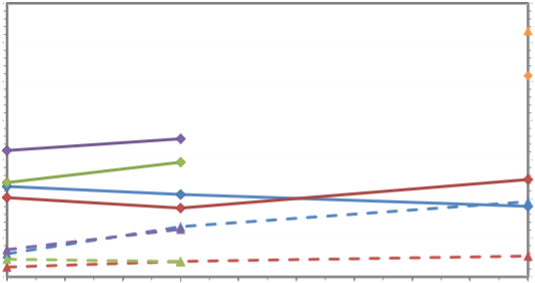
Figure 8: Dissolved available inorganic nitrogen (DAIN) and dissolved available inorganic phosphorus (DAIP) concentrations (mgl-1) in catchment streams (Cct) and Bellozanne WwTW final effluent (Cs)
draining into St. Aubin's Bay, Jersey.
03/08 05/08 07/08 09/08 11/08 01/09 03/09 05/09 07/09 09/09
![]()
![]()
![]()
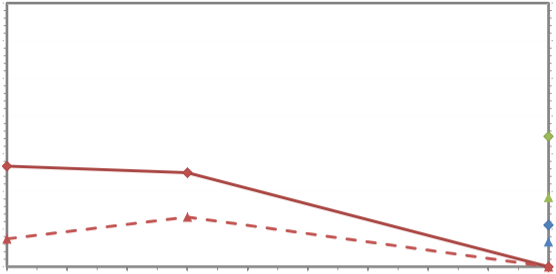
Figure 9: Dissolved available inorganic nitrogen (DAIN) and dissolved available inorganic phosphorus (DAIP) concentrations (mgl-1) in catchment streams (Cct) draining into St. Ouën's Bay, Jersey.
Using the Student's T-test, an analysis of the variation in the concentration of each macro-nutrient across all the catchments revealed only NH3 (P<0.05) and PO4 (DAIP) (P<0.01) varied between spring and summer. A one-way ANOVA was also used to evaluate whether any differences in macro-nutrient concentrations occurred between the three seasons and years. Only NH3 was found to vary (P<0.05).
Student's T-test was also used to analyse any variation in macro-nutrient concentrations between the catchments out-flowing into St. Aubin's and St. Ouën's Bay; none was found to be significant.
The concentration of DAIN from the outfall of the WwTW in September 2009 was 25.74mgl-1, whereas the average DAIN concentration for the watercourses out-falling into St. Aubin's in the same month was only 9.90±2.22 mgl-1, with the highest value of 12.45mgl-1 from the Waterworks valley catchment outfall. The concentration of DAIP
from the WwTW outfall in the same month was again higher than the average for the catchment, 31.54mgl-1 compared to 3.98±2.93 mgl-1, with the highest value of 9.6mgl-1
from the St. Peter 's Valley catchment outfall.
4.1.1. Nutrient loading
Calculations for total nutrient loading (DAIN & DAIP) are shown in Figure 10 and summarised in Table 3. Volumes (Qct) varied from source to outfall as well as varying across the catchments, with the largest volume 290,358m3 from the Les Quennevais catchment outfall. Variations in catchment volumes were found to have an effect on the final loading of DAIN from outfalls. While the Beaumont catchment had the highest average concentration of 16.9mgl-1, Q was actually higher in the Les Quennevais
ct
catchment as a result of a greater catchment volume. The Les Quennevais catchment outfall was hence found to have the highest average monthly DAIN loading (3771kg). The St. Peter's Valley catchment had the highest average DAIP concentration of 0.63mgl-1 and the highest DAIP loading of 115kg.
DAIN loadings in the catchments out-falling into St. Aubin's were higher than those out- falling into St. Ouën's (P<0.05). Although some catchment sources out-falling into St. Aubin's had higher DAIP loadings than those for St. Ouën's, overall this was not found to be significant. This is illustrated in Figure 10; the DAIN loading from catchment sources is significantly greater than those for St. Ouën's but this relationship is not found for DAIP, with very little variation between the two bays.
 Lct (kg)
Watercourse Site Qct (m3) NO3 NO2 NH3 DAIN DAIP
Source 175,106 1,809 19 19 1,848 80 St. Peter s Valley Midway 179,989 1,825 10 11 1,846 65
Outfall 164,600 1,776 10 13 1,799 115
Source 38,997 449 5 5 459 16 Waterworks
Midway 145,620 1,527 18 16 1,561 70 Valley
St. Aubin's Bay Outfall 189,371 1,943 15 10 1,969 41 Source 65,410 711 3 2 715 14
Les Quennevais Midway 104,275 1,069 7 10 1,085 34 Outfall 290,358 3,735 21 15 3,771 57
Source 8,109 116 1 0 117 4 Beaumont Valley Midway 26,352 410 1 2 414 20 Outfall 114,027 2,082 5 3 2,090 70
La Pulente
Outfall 26,280 144 0 1 145 17 Outfall
Source 8,706 144 1 1 146 3 Val de la Mare Midway 57,367 564 3 2 569 24
St. Ouën's Bay
Outfall 74,020 1,169 9 7 1,185 56 Source 52,560 770 3 2 775 25
St Ouëns Valley Midway 52,560 1,000 2 2 1,004 42 Outfall 52,560 892 12 6 910 97

 L (kg)
Watercourse Site Qs (m3) NO NO NsH DAIN DAIP
3 2 3
St. Aubin's Bay 622,367* 7,772 2,430 5,815 16,017 3,926
WwTW Outfall
St. Ouën's Bay - - - - - -
 Table 3: Summary of average monthly macro-nutrient loading (kg) and total volume (m3) in catchment runoff (Lct & Qct) and Bellozanne WwTW effluent (Ls & Qs) inputs to St. Aubin's Bay and St. Ouën's Bay, Jersey (March 08 to September 09) (*Qs taken from Stapleton et al., 2000) .
|
|
| ||
|
|
| ||
|
|
| ||
|
|
| ||
|
|
| ||
|
|
| ||
|
|
| ||
|
|
| ||
|
|
| ||
|
|
| ||
|
|
| ||
|
|
| ||
|
|
|
|
|
Figure 10: Monthly DAIN and DAIP loading (kg) (average of sampling seasons) from catchment streams (Lc) (defined by dashed outline) and WwTW (Ls) draining into St. Aubin's and St. Ouën's Bay, Jersey.
Overall, the WwTW had the highest volume of flow (Qs = 622,367m3) compared to all catchment sources (Qct). In addition to having the highest average DAIN and DAIP
concentrations (25.7mgl-1 and 3.15mgl-1 respectively) compared to catchment sources, the DAIN and DAIP loadings were also higher (16,017kg and 1,936kg respectively).
The WwTW accounts for 62% of the inorganic nitrogen load (DAIN) and 93% of the inorganic phosphorus load (DAIP) into St. Aubin's Bay between 2008-2009 as compared to 54% and 98% in 1997 (Stapleton et al., 2000). However, these figures do not include the loading from Grands Vaux and Bellozanne Valley catchments (as explained in Section 3.1.1).
The total average monthly loading (Lt) of DAIN for St. Aubin's Bay was 25,647kg, a magnitude higher than the loading for St. Ouën's Bay 2,240kg. The total average monthly loading (Lt) of DAIP for St. Aubin's Bay was also substantially higher than for St. Ouën's Bay (2,246kg compared with 171kg). Given that this study has not measured loadings from the Grands Vaux and Bellozanne Valley catchments, both out-falling into St. Aubin's Bay, these figures could potentially be much higher.
- The diversity and abundance of the macro-algal populations of both bays
- Macro-algal populations of the rock abrasion platforms
The results of the surveys are shown in Figure 11, and summarised in Table 4 and Table 5. Using the methodology detailed in WFD UKTAG (2009a) (Section 3.2.1), both sites in St. Ouën's Bay had higher numbers of macroalgal taxa (normalised to shore diversity, Nn) and a lower proportion of opportunistic taxa (Pop). Indeed, the Ecological Status Group Ratios (ESGR) for St. Ouën's were 0.63 and 0.88 – where a higher ratio indicates higher numbers of ESG1 taxa to ESG2 taxa (Table 6). The ecological quality ratio (EQR) for the macro-algal populations of St. Ouën's, was MODERATE (both 0.4) whereas the EQR for St. Aubin's varied between sites. Elizabeth Castle was rated POOR (0.3) and St. Aubin's Fort was rated BAD (0.2). This is confirmed using Species Richness for which St. Ouën's had higher levels (14.00, 15.00) as compared to St. Aubin's (9.00, 6.00) (Table 7). [Refer to APPENDIX 1for examples of macro-algal species classed as ESG1 (Figure 17) and ESG2 (Figure 18)].
The most abundant species, also considered dominant, in St. Aubin's, Elizabeth Castle were Fucus spiralis (Population size, P=28) (ESG1) and Enteromorpha sp. (P=26) (identified as opportunistic and ESG2); St. Aubin's Fort were Fucus spiralis (P=27) (ESG1) and Ulva Lactuca (P=26) (identified as opportunistic and ESG2). Whereas in St. Ouën's, La Pulente were Plumaria plumosa (P=66) (ESG2) and Polysiphonia lanosa (P=51) (ESG2); L'Etacq were Chondrus crispus (P=52) (ESG1) and Plumaria plumosa (P=43) (ESG2) (Table 4).
![]()
![]()
![]()
![]()
![]()
![]()
![]()
![]()
![]()
![]()
![]()
![]()
![]()
![]()
![]()
![]()
![]()
![]()
![]()
![]()
![]()
![]()
![]()
![]()
![]()
![]()
![]()
![]()
![]()
![]()
![]()
![]()
![]()
![]()
![]()
![]()
![]()
![]()
![]()
![]()
![]()
![]()
![]()
![]()
![]()
![]()
![]()
![]()
![]()
![]()
![]()
![]()
![]()
![]()
![]()
![]()
![]()
![]()
![]()
![]()
![]()
![]()
![]()
![]()
![]()
![]()
![]()
![]()
![]()
![]()
![]()
![]()
![]()
![]()
![]()
![]()
![]()
![]()
![]()
![]()
![]()
![]()
![]()
![]()
![]()
![]()
![]()
![]()
![]()
![]()
![]()
![]()
![]()
![]()
![]()
![]()
![]()
![]()
![]()
![]()
![]()
![]()
![]()
![]()
![]()
![]()
![]()
![]()
![]()
![]()
![]()
![]()
![]()
![]()
![]()
![]()
![]()
![]()
![]()
![]()
![]()
![]()
![]()
![]()
![]()
![]()
![]()
![]()
![]()
![]()
![]()
![]()
![]()
![]()
![]()
![]()
![]()
![]()
![]()
![]()
![]()
![]()
![]()
![]()
![]()
![]()
![]()
![]()
![]()
![]()
![]()
![]()
![]()
![]()
![]()
![]()
![]()
![]()
![]()
![]()
![]()
![]()
![]()
![]()
![]()
![]()
![]()
![]()
![]()
![]()
![]()
![]()
![]()
![]()
![]()
![]()
![]()
![]()
![]()
![]()
![]()
![]()
![]()
![]()
![]()
![]()
![]()
![]()
![]()
![]()
![]()
![]()
![]()
![]()
![]()
![]()
![]()
![]()
![]()
![]()
![]()
![]()
![]()
![]()
![]()
![]()
![]()
![]()
![]()
![]()
![]()
![]()
![]()
![]()
![]()
![]()
![]()
![]()
![]()
![]()
![]()
![]()
![]()
![]()
![]()
![]()
![]()
![]()
![]()
![]()
![]()
![]()
![]()
![]()
![]()
![]()
![]()
![]()
![]()
![]()
![]()
![]()
![]()
![]()
![]()
![]()
![]()
![]()
![]()
![]()
![]()
![]()
![]()
![]()
![]()
![]()
![]()
![]()
![]()
![]()
![]()
![]()
![]()
![]()
![]()
![]()
![]()
![]()
![]()
![]()
![]()
![]()
![]()
![]()
![]()
![]()
![]()
![]()
![]()
![]()
![]()
![]()
![]()
![]()
![]()
![]()
![]()
![]()
![]()
![]()
![]()
![]()
![]()
![]()
![]()
![]()
![]()
![]()
![]()
![]()
![]()
![]()
![]()
![]()
![]()
![]()
![]()
![]()
![]()
![]()
![]()
![]()
![]()
![]()
![]()
![]()
![]()
![]()
![]()
![]()
![]()
![]()
![]()
![]()
![]()
![]()
![]()
![]()
![]()
![]()
![]()
![]()
![]()
![]()
![]()
![]()
![]()
![]()
![]()
![]()
![]()
![]()
![]()
![]()
![]()
![]()
![]()
![]()
![]()
![]()
![]()
![]()
![]()
![]()
![]()
![]()
![]()
![]()
![]()
![]()
![]()
![]()
![]()
![]()
![]()
![]()
![]()
![]()
![]()
![]()
![]()
![]()
![]()
![]()
![]()
![]()
![]()
![]()
![]()
![]()
![]()
![]()
![]()
![]()
![]()
![]()
![]()
![]()
![]()
![]()
![]()
![]()
![]()
![]()
![]()
![]()
![]()
![]()
![]()
![]()
![]()
![]()
![]()
![]()
![]()
![]()
![]()
![]()
![]()
![]()
![]()
![]()
![]()
![]()
![]()
![]()
![]()
![]()
![]()
![]()
![]()
![]()
![]()
![]()
![]()
![]()
![]()
![]()
![]()
![]()
![]()
![]()
![]()
![]()
![]()
![]()
![]()
![]()
![]()
![]()
![]()
![]()
![]()
![]()
![]()
![]()
![]()
![]()
![]()
![]()
![]()
![]()
![]()
![]()
![]()
![]()
![]()
![]()
![]()
![]()
![]()
![]()
![]()
![]()
![]()
![]()
![]()
![]()
![]()
![]()
![]()
![]()
![]()
![]()
![]()
![]()
![]()
![]()
![]()
![]()
![]()
![]()
![]()
![]()
![]()
![]()
![]()
![]()
![]()
![]()
![]()
![]()
![]()
![]()
![]()
![]()
![]()
![]()
![]()
![]()
![]()
![]()
![]()
![]()
![]()
![]()
![]()
![]()
![]()
![]()
![]()
![]()
![]()
![]()
![]()
![]()
![]()
![]()
![]()
![]()
![]()
![]()
![]()
![]()
![]()
![]()
![]()
![]()
![]()
![]()
![]()
![]()
![]()
![]()
![]()
![]()
![]()
![]()
![]()
![]()
![]()
![]()
![]()
![]()
![]()
![]()
![]()
![]()
![]()
![]()
![]()
![]()
![]()
![]()
![]()
![]()
![]()
![]()
![]()
![]()
![]()
![]()
![]()
![]()
![]()
![]()
![]()
![]()
![]()
![]()
![]()
![]()
![]()
![]()
![]()
![]()
![]()
![]()
![]()
![]()
![]()
![]()
![]()
![]()
![]()
![]()
![]()
![]()
![]()
![]()
![]()
![]()
![]()
![]()
![]()
![]()
![]()
![]()
![]()
![]()
![]()
![]()
![]()
![]()
![]()
![]()
![]()
![]()
![]()
![]()
![]()
![]()
![]()
![]()
![]()
![]()
![]()
![]()
![]()
![]()
![]()
![]()
![]()
![]()
![]()
![]()
![]()
![]()
![]()
![]()
![]()
![]()
![]()
![]()
![]()
![]()
![]()
![]()
![]()
![]()
![]()
![]()
![]()
![]()
![]()
![]()
![]()
![]()
![]()
![]()
![]()
![]()
![]()
![]()
![]()
![]()
![]()
![]()
![]()
![]()
![]()
![]()
![]()
![]()
![]()
![]()
![]()
![]()
![]()
![]()
![]()
![]()
![]()
![]()
![]()
![]()
![]()
![]()
![]()
![]()
![]()
![]()
![]()
![]()
![]()
![]()
![]()
![]()
![]()
![]()
![]()
![]()
![]()
![]()
![]()
![]()
![]()
![]()
![]()
![]()
![]()
![]()
![]()
![]()
![]()
![]()
![]()
![]()
![]()
![]()
![]()
![]()
![]()
![]()
![]()
![]()
![]()
![]()
![]()
![]()
![]()
![]()
![]()
![]()
![]()
![]()
![]()
![]()
![]()
![]()
![]()
![]()
![]()
![]()
![]()
![]()
![]()
![]()
![]()
![]()
![]()
![]()
![]()
![]()
![]()
![]()
![]()
![]()
![]()
![]()
![]()
![]()
![]()
![]()
![]()
![]()
![]()
![]()
![]()
![]()
![]()
![]()
![]()
![]()
![]()
![]()
![]()
![]()
![]()
![]()
![]()
![]()
![]()
![]()
![]()
![]()
![]()
![]()
![]()
![]()
![]()
![]()
![]()
![]()
![]()
![]()
![]()
![]()
![]()
![]()
![]()
![]()
![]()
![]()
![]()
![]()
![]()
![]()
![]()
![]()
![]()
![]()
![]()
![]()
![]()
![]()
![]()
![]()
![]()
![]()
![]()
![]()
![]()
![]()
![]()
![]()
![]()
![]()
![]()
![]()
![]()
![]()
![]()
![]()
![]()
![]()
![]()
![]()
![]()
![]()
![]()
![]()
![]()
![]()
![]()
![]()
![]()
![]()
![]()
![]()
![]()
![]()
![]()
![]()
![]()
![]()
![]()
![]()
![]()
![]()
![]()
![]()
![]()
![]()
![]()
![]()
![]()
![]()
![]()
![]()
![]()
![]()
![]()
![]()
![]()
![]()
![]()
![]()
![]()
![]()
![]()
![]()
![]()
![]()
![]()
![]()
![]()
![]()
![]()
![]()
![]()
![]()
![]()
![]()
![]()
![]()
![]()
![]()
![]()
![]()
![]()
![]()
![]()
![]()
![]()
![]()
![]()
![]()
![]()
![]()
![]()
![]()
![]()
![]()
![]()
![]()
![]()
![]()
![]()
![]()
![]()
![]()
![]()
![]()
![]()
![]()
![]()
![]()
![]()
![]()
![]()
![]()
![]()
![]()
![]()
![]()
![]()
![]()
![]()
![]()
![]()
![]()
![]()
![]()
![]()
![]()
![]()
![]()
![]()
![]()
![]()
![]()
![]()
![]()
![]()
![]()
![]()
![]()
![]()
![]()
![]()
![]()
![]()
![]()
![]()
![]()
![]()
![]()
![]()
![]()
![]()
![]()
![]()
![]()
![]()
![]()
![]()
![]()
![]()
![]()
![]()
![]()
![]()
![]()
![]()
![]()
![]()
![]()
![]()
![]()
![]()
![]()
![]()
![]()
![]()
![]()
![]()
![]()
![]()
![]()
![]()
![]()
![]()
![]()
![]()
![]()
![]()
![]()
![]()
![]()
![]()
![]()
![]()
![]()
![]()
![]()
![]()
![]()
![]()
![]()
![]()
![]()
![]()
![]()
![]()
![]()
![]()
![]()
![]()
![]()
![]()
![]()
![]()
![]()
![]()
![]()
![]()
![]()
![]()
![]()
![]()
![]()
![]()
![]()
![]()
![]()
![]()
![]()
![]()
![]()
![]()
![]()
![]()
![]()
![]()
![]()
![]()
![]()
![]()
![]()
![]()
![]()
![]()
![]()
![]()
![]()
![]()
![]()
![]()
![]()
![]()
![]()
![]()
![]()
![]()
![]()
![]()
![]()
![]()
![]()
![]()
![]()
![]()
![]()
![]()
![]()
![]()
![]()
![]()
![]()
![]()
![]()
![]()
![]()
![]()
![]()
![]()
![]()
![]()
![]()
![]()
![]()
![]()
![]()
![]()
![]()
![]()
![]()
![]()
![]()
![]()
![]()
![]()
![]()
![]()
![]()
![]()
![]()
![]()
![]()
![]()
![]()
![]()
![]()
![]()
![]()
![]()
![]()
![]()
![]()
![]()
![]()
![]()
![]()
![]()
![]()
![]()
![]()
![]()
![]()
![]()
![]()
![]()
![]()
![]()
![]()
![]()
![]()
![]()
![]()
![]()
![]()
![]()
![]()
![]()
![]()
![]()
![]()
![]()
![]()
![]()
![]()
![]()
![]()
![]()
![]()
![]()
![]()
![]()
![]()
![]()
![]()
![]()
![]()
![]()
![]()
![]()
![]()
![]()
![]()
![]()
![]()
![]()
![]()
![]()
![]()
![]()
![]()
![]()
![]()
![]()
![]()
![]()
![]()
![]()
![]()
![]()
![]()
![]()
![]()
![]()
![]()
![]()
![]()
![]()
![]()
![]()
![]()
![]()
![]()
![]()
![]()
![]()
![]()
![]()
![]()
![]()
![]()
![]()
![]()
![]()
![]()
![]()
![]()
![]()
![]()
![]()
![]()
![]() a) b)
a) b)


![]()

![]()
![]()
![]()
![]()
![]()
![]()
![]()
![]()
![]()
![]()
![]()
![]()
![]()
![]()
![]()
![]()
![]()
![]()
![]()
![]()
![]()
![]()
![]()
![]()
![]()
![]()
![]()
![]()
![]()
![]()
![]()
![]()
![]()
![]()
![]()
![]()
![]()
![]()
![]()
![]()
![]()
![]()
![]()
![]()
![]()
![]()
![]()
![]()
![]()
![]()
![]()
![]()
![]()
![]()
![]()
![]()
![]()
![]()
![]()
![]()
![]()
![]()
![]()
![]()
![]()
![]()
![]()
![]()
![]()
![]()
![]()
![]()
![]()
![]()
![]()
![]()
![]()
![]()
![]()
![]()
![]()
![]()
![]()
![]()
![]()
![]()
![]()
![]()
![]()
![]()
![]()
![]()
![]()
![]()
![]()
![]()
![]()
![]()
![]()
![]()
![]()
![]()
![]()
![]()
![]()
![]()
![]()
![]()
![]()
![]()
![]()
![]()
![]()
![]()
![]()
![]()
![]()
![]()
![]()
![]()
![]()
![]()
![]()
![]()
![]()
![]()
![]()
![]()
![]()
![]()
![]()
![]()
![]()
![]()
![]()
![]()
![]()
![]()
![]()
![]()
![]()
![]()
![]()
![]()
![]()
![]()
![]()
![]()
![]()
![]()
![]()
![]()
![]()
![]()
![]()
![]()
![]()
![]()
![]()
![]()
![]()
![]()
![]()
![]()
![]()
![]()
![]()
![]()
![]()
![]()
![]()
![]()
![]()
![]()
![]()
![]()
![]()
![]()
![]()
![]()
![]()
![]()
![]()
![]()
![]()
![]()
![]()
![]()
![]()
![]()
![]()
![]()
![]()
![]()
![]()
![]()
![]()
![]()
![]()
![]()
![]()
![]()
![]()
![]()
![]()
![]()
![]()
![]()
![]()
![]()
![]()
![]()
![]()
![]()
![]()
![]()
![]()
![]()
![]()
![]()
![]()
![]()
![]()
![]()
![]()
![]()
![]()
![]()
![]()
![]()
![]()
![]()
![]()
![]()
![]()
![]()
![]()
![]()
![]()
![]()
![]()
![]()
![]()
![]()
![]()
![]()
![]()
![]()
![]()
![]()
![]()
![]()
![]()
![]()
![]()
![]()
![]()
![]()
![]()
![]()
![]()
![]()
![]()
![]()
![]()
![]()
![]()
![]()
![]()
![]()
![]()
![]()
![]()
![]()
![]()
![]()
![]()
![]()
![]()
![]()
![]()
![]()
![]()
![]()
![]()
![]()
![]()
![]()
![]()
![]()
![]()
![]()
![]()
![]()
![]()
![]()
![]()
![]()
![]()
![]()
![]()
![]()
![]()
![]()
![]()
![]()
![]()
![]()
![]()
![]()
![]()
![]()
![]()
![]()
![]()
![]()
![]()
![]()
![]()
![]()
![]()
![]()
![]()
![]()
![]()
![]()
![]()
![]()
![]()
![]()
![]()
![]()
![]()
![]()
![]()
![]()
![]()
![]()
![]()
![]()
![]()
![]()
![]()
![]()
![]()
![]()
![]()
![]()
![]()
![]()
![]()
![]()
![]()
![]()
![]()
![]()
![]()
![]()
![]()
![]()
![]()
![]()
![]()
![]()
![]()
![]()
![]()
![]()
![]()
![]()
![]()
![]()
![]()
![]()
![]()
![]()
![]()
![]()
![]()
![]()
![]()
![]()
![]()
![]()
![]()
![]()
![]()
![]()
![]()
![]()
![]()
![]()
![]()
![]()
![]()
![]()
![]()
![]()
![]()
![]()
![]()
![]()
![]()
![]()
![]()
![]()
![]()
![]()
![]()
![]()
![]()
![]()
![]()
![]()
![]()
![]()
![]()
![]()
![]()
![]()
![]()
![]()
![]()
![]()
![]()
![]()
![]()
![]()
![]()
![]()
![]()
![]()
![]()
![]()
![]()
![]()
![]()
![]()
![]()
![]()
![]()
![]()
![]()
![]()
![]()
![]()
![]()
![]()
![]()
![]()
![]()
![]()
![]()
![]()
![]()
![]()
![]()
![]()
![]()
![]()
![]()
![]()
![]()
![]()
![]()
![]()
![]()
![]()
![]()
![]()
![]()
![]()
![]()
![]()
![]()
![]()
![]()
![]()
![]()
![]()
![]()
![]()
![]()
![]()
![]()
![]()
![]()
![]()
![]()
![]()
![]()
![]()
![]()
![]()
![]()
![]()
![]()
![]()
![]()
![]()
![]()
![]()
![]()
![]()
![]()
![]()
![]()
![]()
![]()
![]()
![]()
![]()
![]()
![]()
![]()
![]()
![]()
![]()
![]()
![]()
![]()
![]()
![]()
![]()
![]()
![]()
![]()
![]()
![]()
![]()
![]()
![]()
![]()
![]()
![]()
![]()
![]()
![]()
![]()
![]()
![]()
![]()
![]()
![]()
![]()
![]()
![]()
![]()
![]()
![]()
![]()
![]()
![]()
![]()
![]()
![]()
![]()
![]()
![]()
![]()
![]()
![]()
![]()
![]()
![]()
![]()
![]()
![]()
![]()
![]()
![]()
![]()
![]()
![]()
![]()
![]()
![]()
![]()
![]()
![]()
![]()
![]()
![]()
![]()
![]()
![]()
![]()
![]()
![]()
![]()
![]()
![]()
![]()
![]()
![]()
![]()
![]()
![]()
![]()
![]()
![]()
![]()
![]()
![]()
![]()
![]()
![]()
![]()
![]()
![]()
![]()
![]()
![]()
![]()
![]()
![]()
![]()
![]()
![]()
![]()
![]()
![]()
![]()
![]()
![]()
![]()
![]()
![]()
![]()
![]()
![]()
![]()
![]()
![]()
![]()
![]()
![]()
![]()
![]()
![]()
![]()
![]()
![]()
![]()
![]()
![]()
![]()
![]()
![]()
![]()
![]()
![]()
![]()
![]()
![]()
![]()
![]()
![]()
![]()
![]()
![]()
![]()
![]()
![]()
![]()
![]()
![]()
![]()
![]()
![]()
![]()
![]()
![]()
![]()
![]()
![]()
![]()
![]()
![]()
![]()
![]()
![]()
![]()
![]()
![]()
![]()
![]()
![]()
![]()
![]()
![]()
![]()
![]()
![]()
![]()
![]()
![]()
![]()
![]()
![]()
![]()
![]()
![]()
![]()
![]()
![]()
![]()
![]()
![]()
![]()
![]()
![]()
![]()
![]()
![]()
![]()
![]()
![]()
![]()
![]()
![]()
![]()
![]()
![]()
![]()
![]()
![]()
![]()
![]()
![]()
![]()
![]()
![]()
![]()
![]()
![]()
![]()
![]()
![]()
![]()
![]()
![]()
![]()
![]()
![]()
![]()
![]()
![]()
![]()
![]()
![]()
![]()
![]()
![]()
![]()
![]()
![]()
![]()
![]()
![]()
![]()
![]()
![]()
![]()
![]()
![]()
![]()
![]()
![]()
![]()
![]()
![]()
![]()
![]()
![]()
![]()
![]()
![]()
![]()
![]()
![]()
![]()
![]()
![]()
![]()
![]()
![]()
![]()
![]()
![]()
![]()
![]()
![]()
![]()
![]()
![]()
![]()
![]()
![]()
![]()
![]()
![]()
![]()
![]()
![]()
![]()
![]()
![]()
![]()
![]()
![]()
![]()
![]()
![]()
![]()
![]()
![]()
![]()
![]()
![]()
![]()
![]()
![]()
![]()
![]()
![]()
![]()
![]()
![]()
![]()
![]()
![]()
![]()
![]()
![]()
![]()
![]()
![]()
![]()
![]()
![]()
![]()
![]()
![]()
![]()
![]()
![]()
![]()
![]()
![]()
![]()
![]()
![]()
![]()
![]()
![]()
![]()
![]()
![]()
![]()
![]()
![]()
![]()
![]()
![]()
![]()
![]()
![]()
![]()
![]()
![]()
![]()
![]()
![]()
![]()
![]()
![]()
![]()
![]()
![]()
![]()
![]()
![]()
![]()
![]()
![]()
![]()
![]()
![]()
![]()
![]()
![]()
![]()
![]()
![]()
![]()
![]()
![]()
![]()
![]()
![]()
![]()
![]()
![]()
![]()
![]()
![]()
![]()
![]()
![]()
![]()
![]()
![]()
![]()
![]()
![]()
![]()
![]()
![]()
![]()
![]()
![]()
![]()
![]()
![]()
![]()
![]()
![]()
![]()
![]()
![]()
![]()
![]()
![]()
![]()
![]()
![]()
![]()
![]()
![]()
![]()
![]()
![]()
![]()
![]()
![]()
![]()
![]()
![]()
![]()
![]()
![]()
![]()
![]()
![]()
![]()
![]()
![]()
![]()
![]()
![]()
![]()
![]()
![]()
![]()
![]()
![]()
![]()
![]()
![]()
![]()
![]()
![]()
![]()
![]()
![]()
![]()
![]()
![]()
![]()
![]()
![]()
![]()
![]()
![]()
![]()
![]()
![]()
![]()
![]()
![]()
![]()
![]()
![]()
![]()
![]()
![]()
![]()
![]()
![]()
![]()
![]()
![]()
![]()
![]()
![]()
![]()
![]()
![]()
![]()
![]()
![]()
![]()
![]()
![]()
![]()
![]()
![]()
![]()
![]()
![]()
![]()
![]()
![]()
![]()
![]()
![]()
![]()
![]()
![]()
![]()
![]()
![]()
![]()
![]()
![]()
![]()
![]()
![]()
![]()
![]()
![]()
![]()
![]()
![]()
![]()
![]()
![]()
![]()
![]()
![]()
![]()
![]()
![]()
![]()
![]()
![]()
![]()
![]()
![]()
![]()
![]()
![]()
![]()
![]()
![]()
![]()
![]()
![]()
![]()
![]()
![]()
![]()
![]()
![]()
![]()
![]()
![]()
![]()
![]()
![]()
![]()
![]()
![]()
![]()
![]()
![]()
![]()
![]()
![]()
![]()
![]()
![]()
![]()
![]()
![]()
![]()
![]()
![]()
![]()
![]()
![]()
![]()
![]()
![]()
![]()
![]()
![]()
![]()
![]()
![]()
![]()
![]()
![]()
![]()
![]()
![]()
![]()
![]()
![]()
![]()
![]()
![]()
![]()
![]()
![]()
![]()
![]()
![]()
![]()
![]()
![]()
![]()
![]()
![]()
![]()
![]()
![]()
![]()
![]()
![]()
![]()
![]()
![]()
![]()
![]()
![]()
![]()
![]()
![]()
![]()
![]()
![]()
![]()
![]()
![]()
![]()
![]()
![]()
![]()
![]()
![]()
![]()
![]()
![]()
![]()
![]()
![]()
![]()
![]()
![]()
![]()
![]()
![]()
![]()
![]() c) d)
c) d)


![]()

![]()
![]()
![]()
![]()
![]()
![]()
![]()
![]()
![]()
![]()
![]()
![]()
![]()
![]()
![]()
![]()
![]()
![]()
![]()
![]()
![]()
![]()
![]()
![]()
![]()
![]()
![]()
![]()
![]()
![]()
![]()
![]()
![]()
![]()
![]()
![]()
![]()
![]()
![]()
![]()
![]()
![]()
![]()
![]()
![]()
![]()
![]()
![]()
![]()
![]()
![]()
![]()
![]()
![]()
![]()
![]()
![]()
![]()
![]()
![]()
![]()
![]()
![]()
![]()
![]()
![]()
![]()
![]()
![]()
![]()
![]()
![]()
![]()
![]()
![]() Key:
Key: ![]()
![]()
![]()
![]()
![]()
![]()
![]()
![]()
![]()
![]()
![]()
![]()
![]()
![]()
![]()
![]()
![]()
![]()
![]()
![]()
![]()
![]()
![]()
![]()
![]()
![]()
![]()
![]()
![]()
![]()
![]()
![]()
![]()
![]()
![]()
![]()
![]()
![]()
![]()
![]()
![]()
![]()
![]()
![]()
![]()
![]()
![]()
![]()
![]()
![]()
![]()
![]()
![]()
![]()
![]()
![]()
![]()
![]()
![]()
![]()
![]()
![]()
![]()
![]()
![]()
![]()
![]()
![]()
![]()
![]()
![]()
![]()
![]()
![]()
![]()
![]()
![]()
![]()
![]()
![]()
![]()
![]()
![]()
![]()
![]()
![]()
![]()
![]()
![]()
![]()
![]()
![]()
![]()
![]()
![]()
![]()
![]()
![]()
![]()
![]()
![]()
![]()
![]()
![]()
![]()
![]()
![]()
![]()
![]()
![]()
![]()
![]()
![]()
![]()
![]()
![]()
![]()
![]()
![]()
![]()
![]()
![]()
![]()
![]()
![]()
![]()
![]()
![]()
![]()
![]()
![]()
![]()
![]()
![]()
![]()
![]()
![]() Chaetomorpha linum
Chaetomorpha linum ![]() Fucus serratus
Fucus serratus ![]() Chondrus crispus
Chondrus crispus ![]() Plumaria plumosa
Plumaria plumosa
![]()
![]()
![]()
![]()
![]()
![]()
![]()
![]()
![]()
![]()
![]()
![]()
![]()
![]()
![]()
![]()
![]()
![]()
![]()
![]()
![]()
![]()
![]()
![]()
![]()
![]()
![]()
![]()
![]()
![]()
![]()
![]()
![]()
![]()
![]()
![]()
![]()
![]()
![]()
![]()
![]()
![]()
![]()
![]()
![]()
![]()
![]()
![]()
![]()
![]()
![]()
![]()
![]()
![]()
![]()
![]()
![]()
![]()
![]()
![]()
![]()
![]()
![]()
![]()
![]()
![]()
![]()
![]()
![]()
![]()
![]()
![]()
![]()
![]()
![]()
![]()
![]()
![]()
![]()
![]()
![]()
![]()
![]()
![]()
![]()
![]()
![]()
![]()
![]()
![]()
![]()
![]()
![]()
![]()
![]()
![]()
![]()
![]()
![]()
![]()
![]()
![]()
![]()
![]()
![]()
![]()
![]()
![]()
![]()
![]()
![]()
![]()
![]()
![]()
![]()
![]()
![]()
![]()
![]()
![]()
![]()
![]()
![]()
![]()
![]()
![]()
![]()
![]()
![]()
![]()
![]()
![]()
![]()
![]()
![]()
![]()
![]()
![]()
![]()
![]()
![]()
![]()
![]()
![]()
![]()
![]()
![]()
![]()
![]()
![]()
![]()
![]() Bryopsis plumosa
Bryopsis plumosa ![]() Halidrys siliquosa
Halidrys siliquosa ![]() Enteromorpha sp.
Enteromorpha sp. ![]() Coralina officinalis
Coralina officinalis
![]()
![]()
![]()
![]()
![]()
![]()
![]()
![]()
![]()
![]()
![]()
![]()
![]()
![]()
![]()
![]()
![]()
![]()
![]()
![]()
![]()
![]()
![]()
![]()
![]()
![]()
![]()
![]()
![]()
![]()
![]()
![]()
![]()
![]()
![]()
![]()
![]()
![]()
![]()
![]()
![]()
![]()
![]()
![]()
![]()
![]()
![]()
![]()
![]()
![]()
![]()
![]()
![]()
![]()
![]()
![]()
![]()
![]()
![]()
![]()
![]()
![]()
![]()
![]()
![]()
![]()
![]()
![]()
![]()
![]()
![]()
![]()
![]()
![]()
![]()
![]()
![]()
![]()
![]()
![]()
![]()
![]()
![]()
![]()
![]()
![]()
![]()
![]()
![]()
![]()
![]()
![]()
![]()
![]()
![]()
![]()
![]()
![]()
![]()
![]()
![]()
![]()
![]()
![]()
![]()
![]()
![]()
![]()
![]()
![]()
![]()
![]()
![]()
![]()
![]()
![]()
![]()
![]()
![]()
![]()
![]()
![]()
![]()
![]()
![]()
![]()
![]()
![]()
![]()
![]()
![]()
![]()
![]()
![]()
![]()
![]()
![]()
![]()
![]()
![]()
![]()
![]()
![]()
![]()
![]()
![]()
![]()
![]()
![]()
![]()
![]()
![]()
![]()
![]()
![]()
![]()
![]()
![]()
![]()
![]()
![]()
![]()
![]()
![]()
![]()
![]()
![]()
![]()
![]()
![]()
![]()
![]()
![]()
![]()
![]()
![]()
![]()
![]()
![]()
![]()
![]()
![]()
![]()
![]()
![]()
![]()
![]()
![]()
![]()
![]()
![]()
![]()
![]()
![]()
![]()
![]()
![]()
![]()
![]()
![]()
![]()
![]()
![]()
![]()
![]()
![]()
![]()
![]()
![]()
![]()
![]()
![]()
![]()
![]()
![]()
![]()
![]()
![]()
![]()
![]()
![]()
![]()
![]()
![]()
![]()
![]()
![]()
![]()
![]()
![]()
![]()
![]()
![]()
![]()
![]()
![]()
![]()
![]()
![]()
![]()
![]()
![]()
![]()
![]()
![]()
![]()
![]()
![]()
![]()
![]()
![]()
![]()
![]()
![]()
![]()
![]()
![]()
![]()
![]()
![]()
![]()
![]()
![]()
![]()
![]()
![]()
![]()
![]()
![]()
![]()
![]()
![]()
![]()
![]()
![]()
![]()
![]()
![]()
![]()
![]()
![]()
![]()
![]()
![]()
![]()
![]()
![]()
![]()
![]() Cladophora rupestris
Cladophora rupestris ![]() Gracilaria gracilis
Gracilaria gracilis ![]() Chaetomorpha linum
Chaetomorpha linum ![]() Cladophora rupestris
Cladophora rupestris ![]() Heteorsiphonia plumosa
Heteorsiphonia plumosa ![]() Chaetomorpha mediterranea
Chaetomorpha mediterranea ![]() Polysiphonia lanosa
Polysiphonia lanosa ![]() Fucus spiralis
Fucus spiralis
![]()
![]()
![]()
![]()
![]()
![]()
![]()
![]()
![]()
![]()
![]()
![]()
![]()
![]()
![]()
![]()
![]()
![]()
![]()
![]()
![]()
![]()
![]()
![]()
![]()
![]()
![]()
![]()
![]()
![]()
![]()
![]()
![]()
![]()
![]()
![]()
![]()
![]()
![]()
![]()
![]()
![]()
![]()
![]()
![]()
![]()
![]()
![]()
![]()
![]()
![]()
![]()
![]()
![]()
![]()
![]()
![]()
![]()
![]()
![]()
![]()
![]()
![]()
![]()
![]()
![]()
![]()
![]()
![]()
![]()
![]()
![]()
![]()
![]()
![]()
![]()
![]()
![]()
![]()
![]()
![]()
![]()
![]()
![]()
![]()
![]()
![]()
![]()
![]()
![]()
![]()
![]()
![]()
![]()
![]()
![]()
![]()
![]()
![]()
![]()
![]()
![]()
![]()
![]()
![]()
![]()
![]()
![]()
![]()
![]()
![]()
![]()
![]()
![]()
![]()
![]()
![]()
![]()
![]()
![]()
![]()
![]()
![]()
![]()
![]()
![]()
![]()
![]()
![]()
![]()
![]()
![]()
![]()
![]()
![]()
![]()
![]()
![]()
![]()
![]()
![]()
![]()
![]()
![]()
![]()
![]()
![]()
![]()
![]()
![]()
![]()
![]()
![]() Dictyota dichotoma
Dictyota dichotoma ![]() Fucus vesiculous
Fucus vesiculous ![]() Ulva Lactuca
Ulva Lactuca ![]() Cermaium sp.
Cermaium sp.
![]()
![]()
![]()
![]()
![]()
![]()
![]()
![]()
![]()
![]()
![]()
![]()
![]()
![]()
![]()
![]()
![]()
![]()
![]()
![]()
![]()
![]()
![]()
![]()
![]()
![]()
![]()
![]()
![]()
![]()
![]()
![]()
![]()
![]()
![]()
![]()
![]()
![]()
![]()
![]()
![]()
![]()
![]()
![]()
![]()
![]()
![]()
![]()
![]()
![]()
![]()
![]()
![]()
![]()
![]()
![]()
![]()
![]()
![]()
![]()
![]()
![]()
![]()
![]()
![]()
![]()
![]()
![]() Ceramium nodulosum
Ceramium nodulosum ![]() Polyrides rotundus Opportunistic species
Polyrides rotundus Opportunistic species
Figure 11: Macro-algal populations of St. Aubin's Bay at a) Elizabeth Castle, b) St. Aubin's Fort, and St. Ouën's Bay at c) La Pulante, d) L'Etacq, surveyed in September 2009. (Rounding errors may mean that totals do not equal 100%.)
![]() The diversity of the taxa found at each site were also calculated, both the Simpson index (D') and Shannon index (H') found that the St. Ouën's Bay sites had higher levels of diversity than those in St. Aubin's Bay (Table 7). Indeed the rock abrasion platform at L'Etacq was found to have a more diverse algal flora than the others sites (Table 7), and in the rock pools – a sub-habitat – the bedrock substratum was heavily colonised by algae of varying species. However, when dissimilarities between the sites of each bay were calculated, using Jaccard Distance (J') and Bray-curtis Distance (BCij'), St. Ouën's Bay was found to have more dissimilar sites (Table 8), indicating the sites in St. Aubin's Bay are more homogenous.
The diversity of the taxa found at each site were also calculated, both the Simpson index (D') and Shannon index (H') found that the St. Ouën's Bay sites had higher levels of diversity than those in St. Aubin's Bay (Table 7). Indeed the rock abrasion platform at L'Etacq was found to have a more diverse algal flora than the others sites (Table 7), and in the rock pools – a sub-habitat – the bedrock substratum was heavily colonised by algae of varying species. However, when dissimilarities between the sites of each bay were calculated, using Jaccard Distance (J') and Bray-curtis Distance (BCij'), St. Ouën's Bay was found to have more dissimilar sites (Table 8), indicating the sites in St. Aubin's Bay are more homogenous.
Site Species ESG1 ESG2 Op P C
 Fucus spiralis 28 190
Enteromorpha sp. 26 97
Chaetomorpha mediterranea 19 93
Fucus serratus 9 132 Elizabeth
Fucus vesiculous 8 44 Castle
Bryopsis plumosa 5 8
Ulva Lactuca 5 14 St. Dictyota dichotoma 4 46 Aubin's
Cladophora rupestris 1 4 Bay
Fucus spiralis 27 76
Ulva Lactuca 26 44.5 St. Chaetomorpha mediterranea 4 5 Aubin's Enteromorpha sp. 3 8
Fort Polysiphonia lanosa 3 4.5
Fucus serratus 1 4
Bryopsis plumosa 1 2
![]() Table 4: Macro-algal taxa in order of population size for St. Aubin's Bay, surveyed in September 2009. P= Population size, C= %age cover, op= opportunistic.
Table 4: Macro-algal taxa in order of population size for St. Aubin's Bay, surveyed in September 2009. P= Population size, C= %age cover, op= opportunistic.
Site Species ESG1 ESG2 Op P C
 Plumaria plumosa 66 104.5
Polysiphonia lanosa 51 63
Fucus spiralis 25 216
Chaetomorpha linum 19 20
Fucus serratus 17 216
Coralina officinalis 15 39
Bryopsis plumosa 11 12.5 La Halidrys siliquosa 10 76.5 Pulente
Cladophora rupestris 4 8 Ulva Lactuca 3 5
St. Gracilaria gracilis 3 4 Ouën's Heteorsiphonia plumosa 3 4
Bay Dictyota dichotoma 2 0.5
Fucus vesiculous 2 16 Chaetomorpha mediterranea 2 2 Chondrus crispus 52 54
Plumaria plumosa 43 106 Enteromorpha sp. 32 40.5
Coralina officinalis 25 46 L'Etacq
Fucus serratus 21 333 Chaetomorpha linum 16 18 Cladophora rupestris 16 11.5 Polysiphonia lanosa 15 28
 Fucus spiralis 14 75 Ulva Lactuca 14 22.5 Cermaium sp. 13 14.5 Gracilaria gracilis 5 20 Ceramium nodulosum 2 2 Polyrides rotundus 2 10 Halidrys siliquosa 1 2
Table 5: Macro-algal taxa in order of population size for St. Ouën's Bay, surveyed in September 2009. P= Population size, C= %age cover, op= opportunistic.
![]()

![]()
![]()
![]()
![]()
![]() Location Nn Pch Prh Pop ESGR
Location Nn Pch Prh Pop ESGR
Elizabeth Castle 9.63 0.56 0.00 0.33 0.50 St. Aubin's Bay
Fort 6.42 0.50 0.17 0.50 0.50
La Pulante 13.02 0.36 0.36 0.21 0.63 St. Ouën's Bay
L' Etacq 13.95 0.27 0.53 0.20 0.88 Table 6: Summary of results for each parameter, taken from WFD UKTAG (2009a).
![]()
![]()
![]()
![]()
 Location S D H'
Elizabeth Castle 9.00 0.82 1.87 St. Aubin's Bay
Fort 6.00 0.67 1.11
La Pulante 14.00 0.84 2.98
St. Ouën's Bay
L' Etacq 15.00 0.89 3.73 Table 7: Summary of results for Species richness (S), Simpson Index (D), Shannon Index (H').
![]()
 Dissimilarity between sites J' BCij
St. Aubin's Bay Elizabeth Castle & St. Aubin's Fort 0.4 0.25
St. Ouën's Bay La Pulente & L'Etacq 0.5 0.33
Table 8: Summary of results for dissimilarity tests; Jaccard Distance (J'), Bray-curtis Distance (BCij).
- Growth of pioneer species on settling plates
The results of the settling plates are shown in Figure 12 and summarised in Table 9. The total coverage of macro-algae on the settling plates varied between the sites and bays. Generally the plates in St. Aubin's had less algal cover (63%, 22%), the least at St. Aubin's Fort (Table 9) compared with 85% and 90% for St. Ouën's. This may be due to turbulence at this site, as the plate was found to be partially detached from its mooring. All pioneer species (i.e. first colonisers) identified – found on both the St. Aubin's and St. Ouën's plates – were classed as ESG2, except Coralina officinalis
(ESG1) found on the St. Aubin's Fort plate. ESG2 species are fast growing and are
therefore are likely to colonise substrata first, as seen in both bays. However, no taxa
identified as opportunistic settled on the St. Ouën's plates, whereas Ulva lactuca (ESG2, op) was found on both plates in St. Aubin's Bay, with Chaetomorpha linum (ESG2, op) also found on the Elizabeth Castle plate.
 %age Site Species Division Op ESG1 ESG2
coverage
Cladophora rupestris Chlorophyta 2.0 Elizabeth Ulva Lactuca Chlorophyta 0.5
Castle Chaetomorpha linum Chlorophyta 10.0
St. Ceramium nodulosum Rhodophyta 50.0 Aubin's
Bay Cladophora rupestris Chlorophyta 10.0
St. Ulva Lactuca Chlorophyta 1.0 Aubin's
Fort Ceramium nodulosum Rhodophyta 0.5
Coralina officinalis Rhodophyta 10.0
La Cladophora rupestris Chlorophyta 80.0 Pulente
St. Ceramium nodulosum Rhodophyta 5.0 Ouën's
Bay Cladophora rupestris Chlorophyta 70.0
L'Etacq
Ceramium nodulosum Rhodophyta 20.0

 Table 9: Summary of macro-algal growth on settling plates in St. Aubin's Bay and St. Ouën's Bay, Jersey. a)
![]()
![]()
![]()
![]()
![]()
![]()
![]()
![]()
![]()
![]()
![]()
![]()
![]()
![]()
![]()
![]()
![]()
![]()
![]()
![]()
![]()
![]()
![]()
![]()
![]()
![]()
![]()
![]()
![]()
![]()
![]()
![]()
![]()
![]()
![]()
![]()
![]()
![]()
![]()
![]()
![]()
![]()
![]()
![]()
![]()
![]()
![]()
![]()
![]()
![]()
![]()
![]()
![]()
![]()
![]()
![]()
![]()
![]()
![]()
![]()
![]()
![]()
![]()
![]()
![]()
![]()
![]()
![]()
![]()
![]()
![]()
![]()
![]()
![]()
![]()
![]()
![]()
![]()
![]()
![]()
![]()
![]()
![]()
![]()
![]()
![]()
![]()
![]()
![]()
![]()
![]()
![]()
![]()
![]()
![]()
![]()
![]()
![]()
![]()
![]()
![]()
![]()
![]()
![]()
![]()
![]()
![]()
![]()
![]()
![]()
![]()
![]()
![]()
![]()
![]()
![]()
![]()
![]()
![]()
![]()
![]()
![]()
![]()
![]()
![]()
![]()
![]() b)
b)
![]()
![]()
![]()
![]()
![]()
![]()
![]()
![]()
![]()
![]()
![]()
![]()
![]()
![]()
![]()
![]()
![]()
![]()
![]()
![]()
![]()
![]()
![]()
![]()
![]()
![]()
![]()
![]()
![]()
![]()
![]()
![]()
![]()
![]()
![]()
![]()
![]()
![]()
![]()
![]()
![]()
![]()
![]()
![]()
![]()
![]()
![]()
![]()
![]()
![]()
![]()
![]()
![]()
![]()
![]()
![]()
![]()
![]()
![]()
![]()
![]()
![]()
![]()
![]()
![]()
![]()
![]()
![]()
![]()
![]()
![]()
![]()
![]()
![]()
![]()
![]()
![]()
![]()
![]()
![]()
![]()
![]()
![]()
![]()
![]()
![]()
![]()
![]()
![]()
![]()
![]()
![]()
![]()
![]()
![]()
![]()
![]()
![]()
![]()
![]()
![]()
![]()
![]()
![]()
![]()
![]()
![]()
![]()
![]()
![]()
![]()
![]()
![]()
![]()
![]()
![]()
![]()
![]()
![]()
![]()
![]()
![]()
![]()
![]()
![]()
![]()
![]()
![]()
![]()
![]()
![]()
![]()
![]()
![]()
![]()
![]()
![]()
![]()
![]()
![]()
![]()
![]()
![]()
![]()
![]()
![]()
![]()
![]()
![]()
![]()
![]()
![]()
![]()
![]()
![]()
![]()
![]()
![]()
![]()
![]()
![]()
![]()
![]()
![]()
![]()
![]()
![]()
![]()
![]()
![]()
![]()
![]()
![]()
![]()
![]()
![]()
![]()
![]()
![]()
![]()
![]()
![]()
![]()
![]()
![]()
![]()
![]()
![]()
![]()
![]()
![]()
![]()
![]()
![]()
![]()
![]()
![]()
![]()
![]()
![]()
![]()
![]()
![]()
![]()
![]()
![]()
![]()
![]()
![]()
![]()
![]()
![]()
![]()
![]()
![]()
![]()
![]()
![]()
![]()
![]()
![]()
![]()
![]()
![]()
![]()
![]()
![]()
![]()
![]()
![]()
![]()
![]()
![]()
![]()
![]()
![]()
![]()
![]()
![]()
![]()
![]()
![]()
![]()
![]()
![]()
![]()
![]()
![]()
![]()
![]()
![]()
![]()
![]()
![]()
![]()
![]()
![]()
![]()
![]()
![]()
![]()
![]()
![]()
![]()
![]()
![]()
![]()
![]()
![]()
![]()
![]()
![]()
![]()
![]()
![]()
![]()
![]()
![]()
![]()
![]()
![]()
![]()
![]()
![]()
![]()
![]()
![]()
![]()
![]()
![]()
![]()
![]()
![]()
![]()
![]()
![]()
![]()
![]()
![]()
![]()
![]()
![]()
![]()
![]()
![]()
![]()
![]()
![]() No
No ![]()
![]()
![]()
![]()
![]()
![]()
![]()
![]()
![]()
![]()
![]()
![]()
![]()
![]()
![]()
![]()
![]()
![]()
![]()
![]()
![]()
![]()
![]()
![]()
![]()
![]()
![]()
![]()
![]()
![]()
![]()
![]()
![]()
![]()
![]()
![]()
![]()
![]()
![]()
![]()
![]()
![]()
![]()
![]()
![]()
![]()
![]()
![]()
![]()
![]()
![]()
![]()
![]()
![]()
![]()
![]()
![]()
![]()
![]()
![]()
![]()
![]()
![]()
![]()
![]()
![]()
![]()
![]()
![]()
![]()
![]()
![]()
![]()
![]()
![]()
![]()
![]()
![]()
![]()
![]()
![]()
![]()
![]()
![]()
![]()
![]()
![]()
![]()
![]()
![]()
![]()
![]()
![]()
![]()
![]()
![]()
![]()
![]()
![]()
![]()
![]()
![]()
![]()
![]()
![]()
![]()
![]()
![]()
![]()
![]()
![]()
![]()
![]()
![]()
![]()
![]()
![]()
![]()
![]()
![]()
![]()
![]()
![]()
![]()
![]()
![]()
![]()
![]()
![]()
![]()
![]()
![]()
![]()
![]()
![]()
![]()
![]()
![]()
![]()
![]()
![]()
![]()
![]()
![]()
![]()
![]()
![]()
![]()
![]()
![]()
![]()
![]()
![]()
![]()
![]()
![]()
![]()
![]()
![]()
![]()
![]()
![]()
![]()
![]()
![]()
![]()
![]()
![]()
![]()
![]()
![]()
![]()
![]()
![]()
![]()
![]()
![]()
![]()
![]()
![]()
![]()
![]()
![]()
![]()
![]()
![]()
![]()
![]()
![]()
![]()
![]()
![]()
![]()
![]()
![]()
![]()
![]()
![]()
![]()
![]()
![]()
![]()
![]()
![]()
![]()
![]()
![]()
![]()
![]()
![]()
![]()
![]()
![]()
![]()
![]()
![]()
![]()
![]()
![]()
![]()
![]()
![]()
![]()
![]()
![]()
![]()
![]()
![]()
![]()
![]()
![]()
![]()
![]()
![]()
![]()
![]()
![]()
![]()
![]()
![]()
![]()
![]()
![]()
![]()
![]()
![]()
![]()
![]()
![]()
![]()
![]()
![]()
![]()
![]()
![]()
![]()
![]()
![]()
![]()
![]()
![]()
![]()
![]()
![]()
![]()
![]()
![]()
![]()
![]()
![]()
![]()
![]()
![]()
![]()
![]()
![]()
![]()
![]()
![]()
![]()
![]()
![]()
![]()
![]()
![]()
![]()
![]()
![]()
![]()
![]()
![]()
![]()
![]()
![]()
![]()
![]()
![]()
![]()
![]()
![]()
![]()
![]()
![]()
![]()
![]()
![]()
![]()
![]()
![]()
![]()
![]()
![]()
![]()
![]()
![]()
![]()
![]()
![]()
![]()
![]()
![]()
![]()
![]()
![]()
![]()
![]()
![]()
![]()
![]()
![]()
![]()
![]()
![]()
![]()
![]()
![]()
![]()
![]()
![]()
![]()
![]()
![]()
![]()
![]()
![]()
![]()
![]()
![]()
![]()
![]()
![]()
![]()
![]()
![]()
![]()
![]()
![]()
![]()
![]()
![]()
![]()
![]()
![]()
![]()
![]()
![]()
![]()
![]()
![]()
![]()
![]()
![]()
![]()
![]()
![]()
![]()
![]()
![]()
![]()
![]()
![]()
![]()
![]()
![]()
![]()
![]()
![]()
![]()
![]()
![]()
![]()
![]()
![]()
![]()
![]()
![]()
![]()
![]()
![]()
![]()
![]()
![]()
![]()
![]()
![]()
![]()
![]()
![]()
![]()
![]()
![]()
![]()
![]()
![]()
![]()
![]()
![]()
![]()
![]()
![]()
![]()
![]()
![]()
![]()
![]()
![]()
![]()
![]()
![]()
![]()
![]()
![]()
![]()
![]()
![]()
![]()
![]()
![]()
![]()
![]()
![]()
![]()
![]()
![]()
![]()
![]()
![]()
![]()
![]()
![]()
![]()
![]()
![]()
![]()
![]()
![]()
![]()
![]()
![]()
![]()
![]()
![]()
![]()
![]()
![]()
![]()
![]()
![]()
![]()
![]()
![]()
![]()
![]()
![]()
![]()
![]()
![]()
![]()
![]()
![]()
![]()
![]()
![]()
![]()
![]()
![]()
![]()
![]()
![]()
![]()
![]()
![]()
![]()
![]()
![]()
![]()
![]()
![]()
![]()
![]()
![]()
![]()
![]()
![]()
![]()
![]()
![]()
![]()
![]()
![]()
![]()
![]()
![]()
![]()
![]()
![]()
![]()
![]()
![]()
![]()
![]()
![]()
![]()
![]()
![]()
![]()
![]()
![]()
![]()
![]()
![]()
![]()
![]()
![]()
![]()
![]()
![]()
![]()
![]()
![]()
![]()
![]()
![]()
![]()
![]()
![]()
![]()
![]()
![]()
![]()
![]()
![]()
![]()
![]()
![]()
![]()
![]()
![]()
![]()
![]()
![]()
![]()
![]()
![]()
![]()
![]()
![]()
![]()
![]()
![]()
![]()
![]()
![]()
![]()
![]()
![]()
![]()
![]()
![]()
![]()
![]()
![]()
![]()
![]()
![]()
![]()
![]()
![]()
![]()
![]()
![]()
![]()
![]()
![]()
![]()
![]()
![]()
![]()
![]()
![]()
![]()
![]()
![]()
![]()
![]()
![]()
![]()
![]()
![]()
![]()
![]()
![]()
![]()
![]()
![]()
![]()
![]()
![]()
![]()
![]()
![]()
![]()
![]()
![]()
![]()
![]()
![]()
![]()
![]()
![]()
![]()
![]()
![]()
![]()
![]()
![]()
![]()
![]()
![]()
![]()
![]()
![]()
![]()
![]()
![]()
![]()
![]()
![]()
![]()
![]()
![]()
![]()
![]()
![]()
![]()
![]()
![]()
![]()
![]()
![]()
![]()
![]()
![]()
![]()
![]()
![]()
![]()
![]()
![]()
![]()
![]()
![]()
![]()
![]()
![]()
![]()
![]()
![]()
![]()
![]()
![]()
![]()
![]()
![]()
![]()
![]()
![]()
![]()
![]()
![]()
![]()
![]()
![]()
![]()
![]() coverage
coverage ![]()
![]()
![]()
![]()
![]()
![]()
![]()
![]()
![]()
![]()
![]()
![]()
![]()
![]()
![]()
![]()
![]()
![]()
![]()
![]()
![]()
![]()
![]()
![]()
![]()
![]()
![]()
![]()
![]()
![]()
![]()
![]()
![]()
![]()
![]()
![]()
![]()
![]()
![]()
![]()
![]()
![]()
![]()
![]()
![]()
![]()
![]()
![]()
![]()
![]()
![]()
![]()
![]()
![]()
![]()
![]()
![]()
![]()
![]()
![]()
![]()
![]()
![]()
![]()
![]()
![]()
![]()
![]()
![]()
![]()
![]()
![]()
![]()
![]()
![]()
![]()
![]()
![]()
![]()
![]()
![]()
![]()
![]()
![]()
![]()
![]()
![]()
![]()
![]()
![]()
![]()
![]()
![]()
![]()
![]()
![]()
![]()
![]()
![]()
![]()
![]()
![]()
![]()
![]()
![]()
![]()
![]()
![]()
![]()
![]()
![]()
![]()
![]()
![]()
![]()
![]()
![]()
![]()
![]()
![]()
![]()
![]()
![]()
![]()
![]()
![]()
![]()
![]()
![]()
![]()
![]()
![]()
![]()
![]()
![]()
![]()
![]()
![]()
![]()
![]()
![]()
![]()
![]()
![]()
![]()
![]()
![]()
![]()
![]()
![]()
![]()
![]()
![]()
![]()
![]()
![]()
![]()
![]()
![]()
![]()
![]()
![]()
![]()
![]()
![]()
![]()
![]()
![]()
![]()
![]()
![]()
![]()
![]()
![]()
![]()
![]()
![]()
![]()
![]()
![]()
![]()
![]()
![]()
![]()
![]()
![]()
![]()
![]()
![]()
![]()
![]()
![]()
![]()
![]()
![]()
![]()
![]()
![]()
![]()
![]()
![]()
![]()
![]()
![]()
![]()
![]()
![]()
![]()
![]()
![]()
![]()
![]()
![]()
![]()
![]()
![]()
![]()
![]()
![]()
![]()
![]()
![]()
![]()
![]()
![]()
![]()
![]()
![]()
![]()
![]()
![]()
![]()
![]()
![]()
![]()
![]()
![]()
![]()
![]()
![]()
![]()
![]()
![]()
![]()
![]()
![]()
![]()
![]()
![]()
![]()
![]()
![]()
![]()
![]()
![]()
![]()
![]()
![]()
![]()
![]()
![]()
![]()
![]()
![]()
![]()
![]()
![]()
![]()
![]()
![]()
![]()
![]()
![]()
![]()
![]()
![]()
![]()
![]()
![]()
![]()
![]()
![]()
![]()
![]()
![]()
![]()
![]()
![]()
![]()
![]()
![]()
![]()
![]()
![]()
![]()
![]()
![]()
![]()
![]()
![]()
![]()
![]()
![]()
![]()
![]()
![]()
![]()
![]()
![]()
![]()
![]()
![]()
![]()
![]()
![]()
![]()
![]()
![]()
![]()
![]()
![]()
![]()
![]()
![]()
![]()
![]()
![]()
![]()
![]()
![]()
![]()
![]()
![]()
![]()
![]()
![]()
![]()
![]()
![]()
![]()
![]()
![]()
![]()
![]()
![]()
![]()
![]()
![]()
![]()
![]()
![]()
![]()
![]()
![]()
![]()
![]()
![]()
![]()
![]()
![]()
![]()
![]()
![]()
![]()
![]()
![]()
![]()
![]()
![]()
![]()
![]()
![]()
![]()
![]()
![]()
![]()
![]()
![]()
![]()
![]()
![]()
![]()
![]()
![]()
![]()
![]()
![]()
![]()
![]()
![]()
![]()
![]()
![]()
![]()
![]()
![]()
![]()
![]()
![]()
![]()
![]()
![]()
![]()
![]()
![]()
![]()
![]()
![]()
![]()
![]()
![]()
![]()
![]()
![]()
![]()
![]()
![]()
![]()
![]()
![]()
![]()
![]()
![]()
![]()
![]()
![]()
![]()
![]()
![]()
![]()
![]()
![]()
![]()
![]()
![]()
![]()
![]()
![]()
![]()
![]()
![]()
![]()
![]()
![]()
![]()
![]()
![]()
![]()
![]()
![]()
![]()
![]()
![]()
![]()
![]()
![]()
![]()
![]()
![]()
![]()
![]()
![]()
![]()
![]()
![]()
![]()
![]()
![]()
![]()
![]()
![]()
![]()
![]()
![]()
![]()
![]()
![]()
![]()
![]()
![]()
![]()
![]()
![]()
![]()
![]()
![]()
![]()
![]()
![]()
![]()
![]()
![]()
![]()
![]()
![]()
![]()
![]()
![]()
![]()
![]()
![]()
![]()
![]()
![]()
![]()
![]()
![]()
![]()
![]()
![]()
![]()
![]()
![]()
![]()
![]()
![]()
![]()
![]()
![]()
![]()
![]()
![]()
![]()
![]()
![]()
![]()
![]()
![]()
![]()
![]()
![]()
![]()
![]()
![]()
![]()
![]()
![]()
![]()
![]()
![]()
![]()
![]()
![]()
![]()
![]()
![]()
![]()
![]()
![]()
![]()
![]()
![]()
![]()
![]()
![]()
![]()
![]()
![]()
![]()
![]()
![]()
![]()
![]()
![]()
![]()
![]()
![]()
![]()
![]()
![]()
![]()
![]()
![]()
![]()
![]()
![]()
![]()
![]()
![]()
![]()
![]()
![]()
![]()
![]()
![]()
![]()
![]()
![]()
![]()
![]()
![]()
![]()
![]()
![]()
![]()
![]()
![]()
![]()
![]()
![]()
![]()
![]()
![]()
![]()
![]()
![]()
![]()
![]()
![]()
![]()
![]()
![]()
![]()
![]()
![]()
![]()
![]()
![]()
![]()
![]()
![]()
![]()
![]()
![]()
![]()
![]()
![]()
![]()
![]()
![]()
![]()
![]()
![]()
![]()
![]()
![]()
![]()
![]()
![]()
![]()
![]()
![]()
![]()
![]()
![]()
![]()
![]()
![]()
![]()
![]()
![]()
![]()
![]()
![]()
![]()
![]()
![]()
![]()
![]()
![]()
![]()
![]()
![]()
![]()
![]()
![]()
![]()
![]()
![]()
![]()
![]()
![]()
![]()
![]()
![]()
![]()
![]()
![]()
![]()
![]()
![]()
![]()
![]()
![]()
![]()
![]()
![]()
![]()
![]()
![]()
![]()
![]()
![]()
![]()
![]()
![]()
![]()
![]()
![]()
![]()
![]()
![]()
![]()
![]()
![]()
![]()
![]()
![]()
![]()
![]()
![]()
![]()
![]()
![]()
![]()
![]()
![]()
![]()
![]()
![]()
![]()
![]()
![]()
![]()
![]()
![]()
![]()
![]()
![]()
![]()
![]()
![]()
![]()
![]()
![]()
![]()
![]()
![]()
![]()
![]()
![]()
![]()
![]()
![]()
![]()
![]()
![]()
![]()
![]()
![]()
![]()
![]()
![]()
![]()
![]()
![]()
![]()
![]()
![]()
![]()
![]()
![]()
![]()
![]() 37.5
37.5
![]()
![]()
![]()
![]()
![]()
![]()
![]()
![]()
![]()
![]()
![]()
![]()
![]()
![]()
![]()
![]()
![]()
![]()
![]()
![]()
![]()
![]()
![]()
![]()
![]()
![]()
![]()
![]()
![]()
![]()
![]()
![]()
![]()
![]()
![]()
![]()
![]()
![]()
![]()
![]()
![]()
![]()
![]()
![]()
![]()
![]()
![]()
![]()
![]()
![]()
![]()
![]()
![]()
![]()
![]()
![]()
![]()
![]()
![]()
![]()
![]()
![]()
![]()
![]()
![]()
![]()
![]()
![]()
![]()
![]()
![]()
![]()
![]()
![]()
![]()
![]()
![]()
![]()
![]()
![]()
![]()
![]()
![]()
![]()
![]()
![]()
![]()
![]()
![]()
![]()
![]()
![]()
![]()
![]()
![]()
![]()
![]()
![]()
![]()
![]()
![]()
![]()
![]()
![]()
![]()
![]()
![]()
![]()
![]()
![]()
![]()
![]()
![]()
![]()
![]()
![]()
![]()
![]()
![]()
![]()
![]()
![]()
![]()
![]()
![]()
![]()
![]()
![]()
![]()
![]()
![]()
![]()
![]()
![]()
![]()
![]()
![]()
![]()
![]()
![]()
![]()
![]()
![]()
![]()
![]()
![]()
![]()
![]()
![]()
![]()
![]()
![]()
![]()
![]()
![]()
![]()
![]()
![]()
![]()
![]()
![]()
![]()
![]()
![]()
![]()
![]()
![]()
![]()
![]()
![]()
![]()
![]()
![]()
![]()
![]()
![]()
![]()
![]()
![]()
![]()
![]()
![]()
![]()
![]()
![]()
![]()
![]()
![]()
![]()
![]()
![]()
![]()
![]()
![]()
![]()
![]()
![]()
![]()
![]()
![]()
![]()
![]()
![]()
![]()
![]()
![]()
![]()
![]()
![]()
![]()
![]()
![]()
![]()
![]()
![]()
![]()
![]()
![]()
![]()
![]()
![]()
![]()
![]()
![]()
![]()
![]()
![]()
![]()
![]()
![]()
![]()
![]()
![]()
![]()
![]()
![]()
![]()
![]()
![]()
![]()
![]()
![]()
![]()
![]()
![]()
![]()
![]()
![]()
![]()
![]()
![]()
![]()
![]()
![]()
![]()
![]()
![]()
![]()
![]()
![]()
![]()
![]()
![]()
![]()
![]()
![]()
![]()
![]()
![]()
![]()
![]()
![]()
![]()
![]()
![]()
![]()
![]()
![]()
![]()
![]()
![]()
![]()
![]()
![]()
![]()
![]()
![]()
![]()
![]()
![]()
![]()
![]()
![]()
![]()
![]()
![]()
![]()
![]()
![]()
![]()
![]()
![]()
![]()
![]()
![]()
![]()
![]()
![]()
![]()
![]()
![]()
![]()
![]()
![]()
![]()
![]()
![]()
![]()
![]()
![]()
![]()
![]()
![]()
![]()
![]()
![]()
![]()
![]()
![]()
![]()
![]()
![]()
![]()
![]()
![]()
![]()
![]()
![]()
![]()
![]()
![]()
![]()
![]()
![]()
![]()
![]()
![]()
![]()
![]()
![]()
![]()
![]()
![]()
![]()
![]()
![]()
![]()
![]()
![]()
![]()
![]()
![]()
![]()
![]()
![]()
![]()
![]()
![]()
![]()
![]()
![]()
![]()
![]()
![]()
![]()
![]()
![]()
![]()
![]()
![]()
![]()
![]()
![]()
![]()
![]()
![]()
![]()
![]()
![]()
![]()
![]()
![]()
![]()
![]()
![]()
![]()
![]()
![]()
![]()
![]()
![]()
![]()
![]()
![]()
![]()
![]()
![]()
![]()
![]()
![]()
![]()
![]()
![]()
![]()
![]()
![]()
![]()
![]()
![]()
![]()
![]()
![]()
![]()
![]()
![]()
![]()
![]()
![]()
![]()
![]()
![]()
![]()
![]()
![]()
![]()
![]()
![]()
![]()
![]()
![]()
![]()
![]()
![]()
![]()
![]()
![]()
![]()
![]()
![]()
![]()
![]()
![]()
![]()
![]()
![]()
![]()
![]()
![]()
![]()
![]()
![]()
![]()
![]()
![]()
![]()
![]()
![]()
![]()
![]()
![]()
![]()
![]()
![]()
![]()
![]()
![]()
![]()
![]()
![]()
![]()
![]()
![]()
![]()
![]()
![]()
![]()
![]()
![]()
![]()
![]()
![]()
![]()
![]()
![]()
![]()
![]()
![]()
![]()
![]()
![]()
![]()
![]()
![]()
![]()
![]()
![]()
![]()
![]()
![]()
![]()
![]()
![]()
![]()
![]()
![]()
![]()
![]()
![]()
![]()
![]()
![]()
![]()
![]()
![]()
![]()
![]()
![]()
![]()
![]()
![]()
![]()
![]()
![]()
![]()
![]()
![]()
![]()
![]()
![]()
![]()
![]()
![]()
![]()
![]()
![]()
![]()
![]()
![]()
![]()
![]()
![]()
![]()
![]()
![]()
![]()
![]()
![]()
![]()
![]()
![]()
![]()
![]()
![]()
![]()
![]()
![]()
![]()
![]()
![]()
![]()
![]()
![]()
![]()
![]()
![]()
![]()
![]()
![]()
![]()
![]()
![]()
![]()
![]()
![]()
![]()
![]()
![]()
![]()
![]()
![]()
![]()
![]()
![]()
![]()
![]()
![]()
![]()
![]()
![]()
![]()
![]()
![]()
![]()
![]()
![]()
![]()
![]()
![]()
![]()
![]()
![]()
![]()
![]()
![]()
![]()
![]()
![]()
![]()
![]()
![]()
![]()
![]()
![]()
![]()
![]()
![]()
![]()
![]()
![]()
![]()
![]()
![]()
![]()
![]()
![]()
![]()
![]()
![]()
![]()
![]()
![]()
![]()
![]()
![]()
![]()
![]()
![]()
![]()
![]()
![]()
![]()
![]()
![]()
![]()
![]()
![]()
![]()
![]()
![]()
![]()
![]()
![]()
![]()
![]()
![]()
![]()
![]()
![]()
![]()
![]()
![]()
![]()
![]()
![]()
![]()
![]()
![]()
![]()
![]()
![]()
![]()
![]()
![]()
![]()
![]()
![]()
![]()
![]()
![]()
![]()
![]()
![]()
![]()
![]()
![]()
![]()
![]()
![]()
![]()
![]()
![]()
![]()
![]()
![]()
![]()
![]()
![]()
![]()
![]()
![]()
![]()
![]()
![]()
![]()
![]()
![]()
![]()
![]()
![]()
![]()
![]()
![]()
![]()
![]()
![]()
![]()
![]()
![]()
![]()
![]()
![]()
![]()
![]()
![]()
![]()
![]()
![]()
![]()
![]()
![]()
![]()
![]()
![]()
![]()
![]()
![]()
![]()
![]()
![]()
![]()
![]()
![]()
![]()
![]()
![]()
![]()
![]()
![]()
![]()
![]()
![]()
![]()
![]()
![]()
![]()
![]()
![]()
![]()
![]()
![]()
![]()
![]()
![]()
![]()
![]()
![]()
![]()
![]()
![]()
![]()
![]()
![]()
![]()
![]()
![]()
![]()
![]()
![]()
![]()
![]()
![]()
![]()
![]()
![]()
![]()
![]()
![]()
![]()
![]()
![]()
![]()
![]()
![]()
![]()
![]()
![]()
![]()
![]()
![]()
![]()
![]()
![]()
![]()
![]()
![]()
![]()
![]()
![]()
![]()
![]()
![]()
![]()
![]()
![]()
![]()
![]()
![]()
![]()
![]()
![]()
![]()
![]()
![]()
![]()
![]()
![]()
![]()
![]()
![]()
![]()
![]()
![]()
![]()
![]()
![]()
![]()
![]()
![]()
![]()
![]()
![]()
![]()
![]()
![]()
![]()
![]()
![]()
![]()
![]()
![]()
![]()
![]()
![]()
![]()
![]()
![]()
![]()
![]()
![]()
![]()
![]()
![]()
![]()
![]()
![]()
![]()
![]()
![]()
![]()
![]()
![]()
![]()
![]()
![]()
![]()
![]()
![]()
![]()
![]()
![]()
![]()
![]()
![]()
![]()
![]()
![]()
![]()
![]()
![]()
![]()
![]()
![]()
![]()
![]()
![]()
![]()
![]()
![]()
![]()
![]()
![]()
![]()
![]()
![]()
![]()
![]()
![]()
![]()
![]()
![]()
![]()
![]()
![]()
![]()
![]()
![]()
![]()
![]()
![]()
![]()
![]()
![]()
![]()
![]()
![]()
![]()
![]()
![]()
![]()
![]()
![]()
![]()
![]()
![]()
![]()
![]()
![]()
![]()
![]()
![]()
![]()
![]()
![]()
![]()
![]()
![]()
![]()
![]()
![]()
![]()
![]()
![]()
![]()
![]()
![]()
![]()
![]()
![]()
![]()
![]()
![]()
![]()
![]()
![]()
![]()
![]()
![]()
![]()
![]()
![]()
![]()
![]()
![]()
![]()
![]()
![]()
![]()
![]()
![]()
![]()
![]()
![]()
![]()
![]()
![]()
![]()
![]()
![]()
![]()
![]()
![]()
![]()
![]()
![]()
![]()
![]()
![]()
![]()
![]()
![]()
![]()
![]()
![]()
![]()
![]()
![]()
![]()
![]()
![]()
![]()
![]()
![]()
![]()
![]()
![]()
![]()
![]()
![]()
![]()
![]()
![]()
![]()
![]()
![]()
![]()
![]()
![]()
![]()
![]()
![]()
![]()
![]()
![]()
![]()
![]()
![]()
![]()
![]()
![]()
![]()
![]()
![]()
![]()
![]()
![]()
![]()
![]()
![]()
![]()
![]()
![]()
![]()
![]()
![]()
![]()
![]()
![]()
![]()
![]()
![]()
![]()
![]()
![]()
![]()
![]()
![]()
![]()
![]()
![]()
![]()
![]()
![]()
![]()
![]()
![]()
![]()
![]()
![]()
![]()
![]()
![]()
![]()
![]()
![]()
![]()
![]()
![]()
![]()
![]()
![]()
![]()
![]()
![]()
![]()
![]()
![]()
![]()
![]()
![]()
![]()
![]()
![]()
![]()
![]()
![]()
![]()
![]()
![]()
![]()
![]()
![]()
![]()
![]()
![]()
![]()
![]()
![]()
![]()
![]()
![]()
![]()
![]()
![]()
![]()
![]()
![]()
![]()
![]()
![]()
![]()
![]()
![]()
![]()
![]()
![]()
![]()
![]()
![]()
![]()
![]()
![]()
![]()
![]()
![]()
![]()
![]()
![]()
![]()
![]()
![]()
![]()
![]()
![]()
![]()
![]()
![]()
![]()
![]()
![]()
![]()
![]()
![]()
![]()
![]()
![]()
![]()
![]()
![]()
![]()
![]()
![]()
![]()
![]()
![]()
![]()
![]()
![]()
![]()
![]()
![]()
![]()
![]()
![]()
![]()
![]()
![]()
![]()
![]()
![]()
![]()
![]()
![]()
![]()
![]()
![]()
![]()
![]()
![]()
![]()
![]()
![]()
![]()
![]()
![]()
![]()
![]()
![]()
![]()
![]()
![]()
![]()
![]()
![]()
![]()
![]()
![]()
![]()
![]()
![]()
![]()
![]()
![]()
![]()
![]()
![]()
![]()
![]()
![]()
![]()
![]()
![]()
![]()
![]()
![]()
![]()
![]()
![]()
![]()
![]()
![]()
![]()
![]()
![]()
![]()
![]()
![]()
![]()
![]()
![]()
![]()
![]()
![]()
![]()
![]()
![]()
![]()
![]()
![]()
![]()
![]()
![]()
![]()
![]()
![]()
![]()
![]()
![]()
![]()
![]()
![]()
![]()
![]()
![]()
![]()
![]()
![]()
![]()
![]()
![]()
![]()
![]()
![]()
![]()
![]()
![]()
![]()
![]()
![]()
![]()
![]()
![]()
![]()
![]()
![]()
![]()
![]()
![]()
![]()
![]()
![]()
![]()
![]()
![]()
![]()
![]()
![]()
![]()
![]()
![]()
![]()
![]()
![]()
![]()
![]()
![]()
![]()
![]()
![]()
![]()
![]()
![]()
![]()
![]()
![]()
![]()
![]()
![]()
![]()
![]()
![]()
![]()
![]()
![]()
![]()
![]()
![]()
![]()
![]()
![]()
![]()
![]()
![]()
![]()
![]()
![]()
![]()
![]()
![]()
![]()
![]()
![]()
![]()
![]()
![]()
![]()
![]()
![]()
![]()
![]()
![]()
![]()
![]()
![]()
![]()
![]()
![]()
![]()
![]()
![]()
![]()
![]()
![]()
![]()
![]()
![]()
![]()
![]()
![]()
![]()
![]()
![]()
![]()
![]()
![]()
![]()
![]()
![]()
![]()
![]()
![]()
![]()
![]()
![]()
![]()
![]()
![]()
![]()
![]()
![]()
![]()
![]()
![]()
![]()
![]()
![]()
![]()
![]()
![]()
![]()
![]()
![]()
![]()
![]()
![]()
![]()
![]()
![]()
![]()
![]()
![]()
![]()
![]()
![]()
![]()
![]()
![]()
![]()
![]()
![]()
![]()
![]()
![]()
![]()
![]()
![]()
![]()
![]()
![]()
![]()
![]()
![]()
![]()
![]()
![]()
![]()
![]()
![]()
![]()
![]()
![]()
![]()
![]()
![]()
![]()
![]()
![]()
![]()
![]()
![]()
![]()
![]()
![]()
![]()
![]()
![]()
![]()
![]()
![]()
![]()
![]()
![]()
![]()
![]()
![]()
![]()
![]()
![]()
![]()
![]()
![]()
![]()
![]()
![]()
![]()
![]()
![]()
![]()
![]()
![]()
![]()
![]()
![]()
![]()
![]()
![]()
![]()
![]()
![]()
![]()
![]()
![]()
![]()
![]()
![]()
![]()
![]()
![]()
![]()
![]()
![]()
![]()
![]()
![]()
![]()
![]()
![]()
![]()
![]()
![]()
![]()
![]()
![]()
![]()
![]()
![]()
![]()
![]()
![]()
![]()
![]()
![]()
![]()
![]()
![]()
![]()
![]()
![]()
![]()
![]()
![]()
![]()
![]()
![]()
![]()
![]()
![]()
![]()
![]()
![]()
![]()
![]()
![]()
![]()
![]()
![]()
![]()
![]()
![]()
![]()
![]()
![]()
![]()
![]()
![]()
![]()
![]()
![]()
![]()
![]()
![]()
![]()
![]()
![]()
![]()
![]()
![]()
![]()
![]()
![]()
![]()
![]()
![]()
![]()
![]()
![]()
![]()
![]()
![]()
![]()
![]()
![]()
![]()
![]()
![]()
![]()
![]()
![]()
![]()
![]()
![]()
![]()
![]()
![]()
![]()
![]()
![]()
![]()
![]()
![]()
![]()
![]()
![]()
![]()
![]()
![]()
![]()
![]()
![]()
![]()
![]()
![]()
![]()
![]()
![]()
![]()
![]()
![]()
![]()
![]()
![]()
![]()
![]()
![]()
![]()
![]()
![]()
![]()
![]()
![]()
![]()
![]()
![]()
![]()
![]()
![]()
![]()
![]()
![]()
![]()
![]()
![]()
![]()
![]()
![]()
![]()
![]()
![]()
![]()
![]()
![]()
![]()
![]()
![]()
![]()
![]()
![]()
![]()
![]()
![]()
![]()
![]()
![]()
![]()
![]()
![]()
![]()
![]()
![]()
![]()
![]()
![]()
![]()
![]()
![]()
![]()
![]()
![]()
![]()
![]()
![]()
![]()
![]()
![]()
![]()
![]()
![]()
![]()
![]()
![]()
![]()
![]()
![]()
![]()
![]()
![]()
![]()
![]()
![]()
![]()
![]()
![]()
![]()
![]()
![]()
![]()
![]()
![]()
![]()
![]()
![]()
![]()
![]()
![]()
![]()
![]()
![]()
![]()
![]()
![]()
![]()
![]()
![]()
![]()
![]()
![]()
![]()
![]()
![]()
![]()
![]()
![]()
![]()
![]()
![]()
![]()
![]()
![]()
![]()
![]()
![]()
![]()
![]()
![]()
![]()
![]()
![]()
![]()
![]()
![]()
![]()
![]()
![]()
![]()
![]()
![]()
![]()
![]()
![]()
![]()
![]()
![]()
![]()
![]()
![]()
![]()
![]()
![]()
![]()
![]()
![]()
![]()
![]()
![]()
![]() No Ulva Cladophora coverage Lactuca
No Ulva Cladophora coverage Lactuca
![]()
![]()
![]()
![]()
![]()
![]()
![]()
![]()
![]()
![]()
![]()
![]()
![]()
![]()
![]()
![]()
![]()
![]()
![]()
![]()
![]()
![]()
![]()
![]()
![]()
![]()
![]()
![]()
![]()
![]()
![]()
![]()
![]()
![]()
![]()
![]()
![]()
![]()
![]()
![]()
![]()
![]()
![]()
![]()
![]()
![]()
![]()
![]()
![]()
![]()
![]()
![]()
![]()
![]()
![]()
![]()
![]()
![]()
![]()
![]()
![]()
![]()
![]()
![]()
![]()
![]()
![]()
![]()
![]()
![]()
![]()
![]()
![]()
![]()
![]()
![]()
![]()
![]()
![]()
![]()
![]()
![]()
![]()
![]()
![]()
![]()
![]()
![]()
![]()
![]()
![]()
![]()
![]()
![]()
![]()
![]()
![]()
![]()
![]()
![]()
![]()
![]()
![]()
![]()
![]()
![]()
![]()
![]()
![]()
![]()
![]()
![]()
![]()
![]()
![]()
![]()
![]()
![]()
![]()
![]()
![]()
![]()
![]()
![]()
![]()
![]()
![]()
![]()
![]()
![]()
![]()
![]()
![]()
![]()
![]()
![]()
![]()
![]()
![]()
![]()
![]()
![]()
![]()
![]()
![]()
![]()
![]()
![]()
![]()
![]()
![]()
![]()
![]()
![]()
![]()
![]()
![]()
![]()
![]()
![]()
![]()
![]()
![]()
![]()
![]()
![]()
![]()
![]()
![]()
![]()
![]()
![]()
![]()
![]()
![]()
![]()
![]()
![]()
![]()
![]()
![]()
![]()
![]()
![]()
![]()
![]()
![]()
![]()
![]()
![]()
![]()
![]()
![]()
![]()
![]()
![]()
![]()
![]()
![]()
![]()
![]()
![]()
![]()
![]()
![]()
![]()
![]()
![]()
![]()
![]()
![]()
![]()
![]()
![]()
![]()
![]()
![]()
![]()
![]()
![]()
![]()
![]()
![]()
![]()
![]()
![]()
![]()
![]()
![]()
![]()
![]()
![]()
![]()
![]()
![]()
![]()
![]()
![]()
![]()
![]()
![]()
![]()
![]()
![]()
![]()
![]()
![]()
![]()
![]()
![]()
![]()
![]()
![]()
![]()
![]()
![]()
![]()
![]()
![]()
![]()
![]()
![]()
![]()
![]()
![]()
![]()
![]()
![]()
![]()
![]()
![]()
![]()
![]()
![]()
![]()
![]()
![]()
![]()
![]()
![]()
![]()
![]()
![]()
![]()
![]()
![]()
![]()
![]()
![]()
![]()
![]()
![]()
![]()
![]()
![]()
![]()
![]()
![]()
![]()
![]()
![]()
![]()
![]()
![]()
![]()
![]()
![]()
![]()
![]()
![]()
![]()
![]()
![]()
![]()
![]()
![]()
![]()
![]()
![]()
![]()
![]()
![]()
![]()
![]()
![]()
![]()
![]()
![]()
![]()
![]()
![]()
![]()
![]()
![]()
![]()
![]()
![]()
![]()
![]()
![]()
![]()
![]()
![]()
![]()
![]()
![]()
![]()
![]()
![]()
![]()
![]()
![]()
![]()
![]()
![]()
![]()
![]()
![]()
![]()
![]()
![]()
![]()
![]()
![]()
![]()
![]()
![]()
![]()
![]()
![]()
![]()
![]()
![]()
![]()
![]()
![]()
![]()
![]()
![]()
![]()
![]()
![]()
![]()
![]()
![]()
![]()
![]()
![]()
![]()
![]()
![]()
![]()
![]()
![]()
![]()
![]()
![]()
![]()
![]()
![]()
![]()
![]()
![]()
![]()
![]()
![]()
![]()
![]()
![]()
![]()
![]()
![]()
![]()
![]()
![]()
![]()
![]()
![]()
![]()
![]()
![]()
![]()
![]()
![]()
![]()
![]()
![]()
![]()
![]()
![]()
![]()
![]()
![]()
![]()
![]()
![]()
![]()
![]()
![]()
![]()
![]()
![]()
![]()
![]()
![]()
![]()
![]()
![]()
![]()
![]()
![]()
![]()
![]()
![]()
![]()
![]()
![]()
![]()
![]()
![]()
![]()
![]()
![]()
![]()
![]()
![]()
![]()
![]()
![]()
![]()
![]()
![]()
![]()
![]()
![]()
![]()
![]()
![]()
![]()
![]()
![]()
![]()
![]()
![]()
![]()
![]()
![]()
![]()
![]()
![]()
![]()
![]()
![]()
![]()
![]()
![]()
![]()
![]()
![]()
![]()
![]()
![]()
![]()
![]()
![]()
![]()
![]()
![]()
![]()
![]()
![]()
![]()
![]()
![]()
![]()
![]()
![]()
![]()
![]()
![]()
![]()
![]()
![]()
![]()
![]()
![]()
![]()
![]()
![]()
![]()
![]()
![]()
![]()
![]()
![]()
![]()
![]()
![]()
![]()
![]()
![]()
![]()
![]()
![]()
![]()
![]()
![]()
![]()
![]()
![]()
![]()
![]()
![]()
![]()
![]()
![]()
![]()
![]()
![]()
![]()
![]()
![]()
![]()
![]()
![]()
![]()
![]()
![]()
![]()
![]()
![]()
![]()
![]()
![]()
![]()
![]()
![]()
![]()
![]()
![]()
![]()
![]()
![]()
![]()
![]()
![]()
![]()
![]()
![]()
![]()
![]()
![]()
![]()
![]()
![]()
![]()
![]()
![]()
![]()
![]()
![]()
![]()
![]()
![]()
![]()
![]()
![]()
![]()
![]()
![]()
![]()
![]()
![]()
![]()
![]()
![]()
![]()
![]()
![]()
![]()
![]()
![]()
![]()
![]()
![]()
![]()
![]()
![]()
![]()
![]()
![]()
![]()
![]()
![]()
![]()
![]()
![]()
![]()
![]()
![]()
![]()
![]()
![]()
![]()
![]()
![]()
![]()
![]()
![]()
![]()
![]()
![]()
![]()
![]()
![]()
![]()
![]()
![]()
![]()
![]()
![]()
![]()
![]()
![]()
![]()
![]()
![]()
![]()
![]()
![]()
![]()
![]()
![]()
![]()
![]()
![]()
![]()
![]()
![]()
![]()
![]()
![]()
![]()
![]()
![]()
![]()
![]()
![]()
![]()
![]()
![]()
![]()
![]()
![]()
![]()
![]()
![]()
![]()
![]()
![]()
![]()
![]()
![]()
![]()
![]()
![]()
![]()
![]()
![]()
![]()
![]()
![]()
![]()
![]()
![]()
![]()
![]()
![]()
![]()
![]()
![]()
![]()
![]()
![]()
![]()
![]()
![]()
![]()
![]()
![]()
![]()
![]()
![]()
![]()
![]()
![]()
![]()
![]()
![]()
![]()
![]()
![]()
![]()
![]()
![]()
![]()
![]()
![]()
![]()
![]()
![]()
![]()
![]()
![]()
![]()
![]()
![]()
![]()
![]()
![]()
![]()
![]()
![]()
![]()
![]()
![]()
![]()
![]()
![]()
![]()
![]()
![]()
![]()
![]()
![]()
![]()
![]()
![]()
![]()
![]()
![]()
![]()
![]()
![]()
![]()
![]()
![]()
![]()
![]()
![]()
![]()
![]()
![]()
![]()
![]()
![]()
![]()
![]()
![]()
![]()
![]()
![]()
![]()
![]()
![]()
![]()
![]()
![]()
![]()
![]()
![]()
![]()
![]()
![]()
![]()
![]()
![]()
![]()
![]()
![]()
![]()
![]()
![]()
![]()
![]()
![]()
![]()
![]()
![]()
![]()
![]()
![]()
![]()
![]()
![]()
![]()
![]()
![]()
![]()
![]()
![]()
![]()
![]()
![]()
![]()
![]()
![]()
![]()
![]()
![]()
![]()
![]()
![]()
![]()
![]()
![]()
![]()
![]()
![]()
![]()
![]()
![]()
![]()
![]()
![]()
![]()
![]()
![]()
![]()
![]()
![]()
![]()
![]()
![]()
![]()
![]()
![]()
![]()
![]()
![]()
![]()
![]()
![]()
![]()
![]()
![]()
![]()
![]()
![]()
![]()
![]()
![]()
![]()
![]()
![]()
![]()
![]()
![]()
![]()
![]()
![]()
![]()
![]()
![]()
![]()
![]()
![]()
![]()
![]()
![]()
![]()
![]()
![]()
![]()
![]()
![]()
![]()
![]()
![]()
![]()
![]()
![]()
![]()
![]()
![]()
![]()
![]()
![]()
![]()
![]()
![]()
![]()
![]()
![]()
![]()
![]()
![]()
![]()
![]()
![]()
![]()
![]()
![]()
![]()
![]()
![]()
![]()
![]()
![]()
![]()
![]()
![]()
![]()
![]()
![]()
![]()
![]()
![]()
![]()
![]()
![]()
![]()
![]()
![]()
![]()
![]()
![]()
![]()
![]()
![]()
![]()
![]()
![]()
![]()
![]()
![]()
![]()
![]()
![]()
![]()
![]()
![]()
![]()
![]()
![]()
![]()
![]()
![]()
![]()
![]()
![]()
![]()
![]()
![]()
![]()
![]()
![]()
![]()
![]()
![]()
![]()
![]()
![]()
![]()
![]()
![]()
![]()
![]()
![]()
![]()
![]()
![]()
![]()
![]()
![]()
![]()
![]()
![]()
![]()
![]()
![]()
![]()
![]()
![]()
![]()
![]()
![]()
![]()
![]()
![]()
![]()
![]()
![]()
![]()
![]()
![]()
![]()
![]()
![]()
![]()
![]()
![]()
![]()
![]()
![]()
![]()
![]()
![]()
![]()
![]()
![]()
![]()
![]()
![]()
![]()
![]()
![]()
![]()
![]()
![]()
![]()
![]()
![]()
![]()
![]()
![]()
![]()
![]()
![]()
![]()
![]()
![]()
![]()
![]()
![]()
![]()
![]()
![]()
![]()
![]()
![]()
![]()
![]()
![]()
![]()
![]()
![]()
![]()
![]()
![]()
![]()
![]()
![]()
![]()
![]()
![]()
![]()
![]()
![]()
![]()
![]()
![]()
![]()
![]()
![]()
![]()
![]()
![]()
![]()
![]()
![]()
![]()
![]()
![]()
![]()
![]()
![]()
![]()
![]()
![]()
![]()
![]()
![]()
![]()
![]()
![]()
![]()
![]()
![]()
![]()
![]()
![]()
![]()
![]()
![]()
![]()
![]()
![]()
![]()
![]()
![]()
![]()
![]()
![]()
![]()
![]()
![]()
![]()
![]()
![]()
![]()
![]()
![]()
![]()
![]()
![]()
![]()
![]()
![]()
![]()
![]()
![]()
![]()
![]()
![]()
![]()
![]()
![]()
![]()
![]()
![]()
![]()
![]()
![]()
![]()
![]()
![]()
![]()
![]()
![]()
![]()
![]()
![]()
![]()
![]()
![]()
![]()
![]()
![]()
![]()
![]()
![]()
![]()
![]()
![]()
![]()
![]()
![]()
![]()
![]()
![]()
![]()
![]()
![]()
![]()
![]()
![]()
![]()
![]()
![]()
![]()
![]()
![]()
![]()
![]()
![]()
![]()
![]()
![]()
![]()
![]()
![]()
![]()
![]()
![]()
![]()
![]()
![]()
![]()
![]()
![]()
![]()
![]()
![]()
![]()
![]()
![]()
![]()
![]()
![]()
![]()
![]()
![]()
![]()
![]()
![]()
![]()
![]()
![]()
![]()
![]()
![]()
![]()
![]()
![]()
![]()
![]()
![]()
![]()
![]()
![]()
![]()
![]()
![]()
![]()
![]()
![]()
![]()
![]()
![]()
![]()
![]()
![]()
![]()
![]()
![]()
![]()
![]()
![]()
![]()
![]()
![]()
![]()
![]()
![]()
![]()
![]()
![]()
![]()
![]()
![]()
![]()
![]()
![]()
![]()
![]()
![]()
![]()
![]()
![]()
![]()
![]()
![]()
![]()
![]()
![]()
![]()
![]()
![]()
![]()
![]()
![]()
![]()
![]()
![]()
![]()
![]()
![]()
![]()
![]()
![]()
![]()
![]()
![]()
![]()
![]()
![]()
![]()
![]()
![]()
![]()
![]()
![]()
![]()
![]()
![]()
![]()
![]()
![]()
![]()
![]()
![]()
![]()
![]()
![]()
![]()
![]()
![]()
![]()
![]()
![]()
![]()
![]()
![]()
![]()
![]()
![]()
![]()
![]()
![]()
![]()
![]()
![]()
![]()
![]()
![]()
![]()
![]()
![]()
![]()
![]()
![]()
![]()
![]()
![]()
![]()
![]()
![]()
![]()
![]()
![]()
![]()
![]()
![]()
![]()
![]()
![]()
![]()
![]()
![]()
![]()
![]()
![]()
![]()
![]()
![]()
![]()
![]()
![]()
![]()
![]()
![]()
![]()
![]()
![]()
![]()
![]()
![]()
![]()
![]()
![]()
![]()
![]()
![]()
![]()
![]()
![]()
![]()
![]()
![]()
![]()
![]()
![]()
![]()
![]()
![]()
![]()
![]()
![]()
![]()
![]()
![]()
![]()
![]()
![]()
![]()
![]()
![]()
![]()
![]()
![]()
![]()
![]()
![]()
![]()
![]()
![]()
![]()
![]()
![]()
![]()
![]()
![]()
![]()
![]()
![]()
![]()
![]()
![]()
![]()
![]()
![]()
![]()
![]()
![]()
![]()
![]()
![]()
![]()
![]()
![]()
![]()
![]()
![]()
![]()
![]()
![]()
![]()
![]()
![]()
![]()
![]()
![]()
![]()
![]()
![]()
![]()
![]()
![]()
![]()
![]()
![]()
![]()
![]()
![]()
![]()
![]()
![]()
![]()
![]()
![]()
![]()
![]()
![]()
![]()
![]()
![]()
![]()
![]()
![]()
![]()
![]()
![]()
![]()
![]()
![]()
![]()
![]()
![]()
![]()
![]()
![]()
![]()
![]()
![]()
![]()
![]()
![]()
![]()
![]()
![]()
![]()
![]()
![]()
![]()
![]()
![]()
![]()
![]()
![]()
![]()
![]()
![]()
![]()
![]()
![]()
![]()
![]()
![]()
![]()
![]()
![]()
![]()
![]()
![]()
![]()
![]()
![]()
![]()
![]()
![]()
![]()
![]()
![]()
![]()
![]()
![]()
![]()
![]()
![]()
![]()
![]()
![]()
![]()
![]()
![]()
![]()
![]()
![]()
![]()
![]()
![]()
![]()
![]()
![]()
![]()
![]()
![]()
![]()
![]()
![]()
![]()
![]()
![]()
![]()
![]()
![]()
![]()
![]()
![]()
![]()
![]()
![]()
![]()
![]()
![]()
![]()
![]()
![]()
![]()
![]()
![]()
![]()
![]()
![]()
![]()
![]()
![]()
![]()
![]()
![]()
![]()
![]()
![]()
![]()
![]()
![]()
![]()
![]()
![]()
![]()
![]()
![]()
![]()
![]()
![]()
![]()
![]()
![]()
![]()
![]()
![]()
![]()
![]()
![]()
![]()
![]()
![]()
![]()
![]()
![]()
![]()
![]()
![]()
![]()
![]()
![]()
![]()
![]()
![]()
![]()
![]()
![]()
![]()
![]()
![]()
![]()
![]()
![]()
![]()
![]()
![]()
![]()
![]()
![]()
![]()
![]()
![]()
![]()
![]()
![]()
![]()
![]()
![]()
![]()
![]()
![]()
![]()
![]()
![]()
![]()
![]()
![]()
![]()
![]()
![]()
![]()
![]()
![]()
![]()
![]()
![]()
![]()
![]()
![]()
![]()
![]()
![]()
![]()
![]()
![]()
![]()
![]()
![]()
![]()
![]()
![]()
![]()
![]()
![]()
![]()
![]()
![]()
![]()
![]()
![]()
![]()
![]()
![]()
![]()
![]()
![]()
![]()
![]()
![]()
![]()
![]()
![]()
![]()
![]()
![]()
![]()
![]()
![]()
![]()
![]()
![]()
![]()
![]()
![]()
![]()
![]()
![]()
![]()
![]()
![]()
![]()
![]()
![]()
![]()
![]()
![]()
![]()
![]()
![]()
![]()
![]()
![]()
![]()
![]()
![]()
![]()
![]()
![]()
![]()
![]()
![]()
![]()
![]()
![]()
![]()
![]()
![]()
![]()
![]()
![]()
![]()
![]()
![]()
![]()
![]()
![]()
![]()
![]()
![]()
![]()
![]()
![]()
![]()
![]()
![]()
![]()
![]()
![]()
![]()
![]()
![]()
![]()
![]()
![]()
![]()
![]()
![]()
![]()
![]()
![]()
![]()
![]()
![]()
![]()
![]()
![]()
![]()
![]()
![]()
![]()
![]()
![]()
![]()
![]()
![]()
![]()
![]()
![]()
![]()
![]()
![]()
![]()
![]()
![]()
![]()
![]()
![]()
![]()
![]()
![]()
![]()
![]()
![]()
![]()
![]()
![]()
![]()
![]()
![]()
![]()
![]()
![]()
![]()
![]()
![]()
![]()
![]()
![]()
![]()
![]()
![]()
![]()
![]()
![]()
![]()
![]()
![]()
![]()
![]()
![]()
![]()
![]()
![]()
![]()
![]()
![]()
![]()
![]()
![]()
![]()
![]()
![]()
![]()
![]()
![]()
![]()
![]()
![]()
![]()
![]()
![]()
![]()
![]()
![]()
![]()
![]()
![]()
![]()
![]()
![]()
![]()
![]()
![]()
![]()
![]()
![]()
![]()
![]()
![]()
![]()
![]()
![]()
![]()
![]()
![]()
![]()
![]()
![]()
![]()
![]()
![]()
![]()
![]()
![]()
![]()
![]()
![]()
![]()
![]()
![]()
![]()
![]()
![]()
![]()
![]()
![]()
![]()
![]()
![]()
![]()
![]()
![]()
![]()
![]()
![]()
![]()
![]()
![]()
![]()
![]()
![]()
![]()
![]()
![]()
![]()
![]()
![]()
![]()
![]()
![]()
![]()
![]()
![]()
![]()
![]()
![]()
![]()
![]()
![]()
![]()
![]()
![]()
![]()
![]()
![]()
![]()
![]()
![]()
![]()
![]()
![]()
![]()
![]()
![]()
![]()
![]()
![]()
![]()
![]()
![]()
![]()
![]()
![]()
![]()
![]()
![]()
![]()
![]()
![]()
![]()
![]()
![]()
![]()
![]()
![]()
![]()
![]()
![]() Other rupestris 79% Other 1%
Other rupestris 79% Other 1% ![]()
![]() 2.5 2
2.5 2 ![]()
![]() 1%
1% ![]()
![]()
![]()
![]()
![]()
![]()
![]()
![]()
![]()
![]()
![]()
![]()
![]()
![]()
![]()
![]()
![]()
![]()
![]()
![]()
![]()
![]()
![]()
![]()
![]()
![]()
![]()
![]()
![]()
![]()
![]()
![]()
![]()
![]()
![]()
![]()
![]()
![]()
![]()
![]()
![]()
![]()
![]()
![]()
![]()
![]()
![]()
![]()
![]()
![]()
![]()
![]()
![]()
![]()
![]()
![]()
![]()
![]()
![]()
![]()
![]()
![]()
![]()
![]()
![]()
![]()
![]()
![]()
![]()
![]()
![]()
![]()
![]()
![]()
![]()
![]()
![]()
![]()
![]()
![]()
![]()
![]()
![]()
![]()
![]()
![]()
![]()
![]()
![]()
![]()
![]()
![]()
![]()
![]()
![]()
![]()
![]()
![]()
![]()
![]()
![]()
![]()
![]()
![]()
![]()
![]()
![]()
![]()
![]()
![]()
![]()
![]()
![]()
![]()
![]()
![]()
![]()
![]()
![]()
![]()
![]()
![]()
![]()
![]()
![]()
![]()
![]()
![]()
![]()
![]()
![]()
![]()
![]()
![]()
![]()
![]()
![]()
![]()
![]()
![]()
![]()
![]()
![]()
![]()
![]()
![]()
![]()
![]()
![]()
![]()
![]()
![]()
![]()
![]()
![]()
![]()
![]()
![]()
![]()
![]()
![]()
![]()
![]()
![]()
![]()
![]()
![]()
![]()
![]()
![]()
![]()
![]()
![]()
![]()
![]()
![]()
![]()
![]()
![]()
![]()
![]()
![]()
![]()
![]()
![]()
![]()
![]()
![]()
![]()
![]()
![]()
![]()
![]()
![]()
![]()
![]()
![]()
![]()
![]()
![]()
![]()
![]()
![]()
![]()
![]()
![]()
![]()
![]()
![]()
![]()
![]()
![]()
![]()
![]()
![]()
![]()
![]()
![]()
![]()
![]()
![]()
![]()
![]()
![]()
![]()
![]()
![]()
![]()
![]()
![]()
![]()
![]()
![]()
![]()
![]()
![]()
![]()
![]()
![]()
![]()
![]()
![]()
![]()
![]()
![]()
![]()
![]()
![]()
![]()
![]()
![]()
![]()
![]()
![]()
![]()
![]()
![]()
![]()
![]()
![]()
![]()
![]()
![]()
![]()
![]()
![]()
![]()
![]()
![]()
![]()
![]()
![]()
![]()
![]()
![]()
![]()
![]()
![]()
![]()
![]()
![]()
![]()
![]()
![]()
![]()
![]()
![]()
![]()
![]()
![]()
![]()
![]()
![]()
![]()
![]()
![]()
![]()
![]()
![]()
![]()
![]()
![]()
![]()
![]()
![]()
![]()
![]()
![]()
![]()
![]()
![]()
![]()
![]()
![]()
![]()
![]()
![]()
![]()
![]()
![]()
![]()
![]()
![]()
![]()
![]()
![]()
![]()
![]()
![]()
![]()
![]()
![]()
![]()
![]()
![]()
![]()
![]()
![]()
![]()
![]()
![]()
![]()
![]()
![]()
![]()
![]()
![]()
![]()
![]()
![]()
![]()
![]()
![]()
![]()
![]()
![]()
![]()
![]()
![]()
![]()
![]()
![]()
![]()
![]()
![]()
![]()
![]()
![]()
![]()
![]()
![]()
![]()
![]()
![]()
![]()
![]()
![]()
![]()
![]()
![]()
![]()
![]()
![]()
![]()
![]()
![]()
![]()
![]()
![]()
![]()
![]()
![]()
![]()
![]()
![]()
![]()
![]()
![]()
![]()
![]()
![]()
![]()
![]()
![]()
![]()
![]()
![]()
![]()
![]()
![]()
![]()
![]()
![]()
![]()
![]()
![]()
![]()
![]()
![]()
![]()
![]()
![]()
![]()
![]()
![]()
![]()
![]()
![]()
![]()
![]()
![]()
![]()
![]()
![]()
![]()
![]()
![]()
![]()
![]()
![]()
![]()
![]()
![]()
![]()
![]()
![]()
![]()
![]()
![]()
![]()
![]()
![]()
![]()
![]()
![]()
![]()
![]()
![]()
![]()
![]()
![]()
![]()
![]()
![]()
![]()
![]()
![]()
![]()
![]()
![]()
![]()
![]()
![]()
![]()
![]()
![]()
![]()
![]()
![]()
![]()
![]()
![]()
![]()
![]()
![]()
![]()
![]()
![]()
![]()
![]()
![]()
![]()
![]()
![]()
![]()
![]()
![]()
![]()
![]()
![]()
![]()
![]()
![]()
![]()
![]()
![]()
![]()
![]()
![]()
![]()
![]()
![]()
![]()
![]()
![]()
![]()
![]()
![]()
![]()
![]()
![]()
![]()
![]()
![]()
![]()
![]()
![]()
![]()
![]()
![]()
![]()
![]()
![]()
![]()
![]()
![]()
![]()
![]()
![]()
![]()
![]()
![]()
![]()
![]()
![]()
![]()
![]()
![]()
![]()
![]()
![]()
![]()
![]()
![]()
![]()
![]()
![]()
![]()
![]()
![]()
![]()
![]()
![]()
![]()
![]()
![]()
![]()
![]()
![]()
![]()
![]()
![]()
![]()
![]()
![]()
![]()
![]()
![]()
![]()
![]()
![]()
![]()
![]()
![]()
![]()
![]()
![]()
![]()
![]()
![]()
![]()
![]()
![]()
![]()
![]()
![]()
![]()
![]()
![]()
![]()
![]()
![]()
![]()
![]()
![]()
![]()
![]()
![]()
![]()
![]()
![]()
![]()
![]()
![]()
![]()
![]()
![]()
![]()
![]()
![]()
![]()
![]()
![]()
![]()
![]()
![]()
![]()
![]()
![]()
![]()
![]()
![]()
![]()
![]()
![]()
![]()
![]()
![]()
![]()
![]()
![]()
![]()
![]()
![]()
![]()
![]()
![]()
![]()
![]()
![]()
![]()
![]()
![]()
![]()
![]()
![]()
![]()
![]()
![]()
![]()
![]()
![]()
![]()
![]()
![]()
![]()
![]()
![]()
![]()
![]()
![]()
![]()
![]()
![]()
![]()
![]()
![]()
![]()
![]()
![]()
![]()
![]()
![]()
![]()
![]()
![]()
![]()
![]()
![]()
![]()
![]()
![]()
![]()
![]()
![]()
![]()
![]()
![]()
![]()
![]()
![]()
![]()
![]()
![]()
![]()
![]()
![]()
![]()
![]()
![]()
![]()
![]()
![]()
![]()
![]()
![]()
![]()
![]()
![]()
![]()
![]()
![]()
![]()
![]()
![]()
![]()
![]()
![]()
![]()
![]()
![]()
![]()
![]()
![]()
![]()
![]()
![]()
![]()
![]()
![]()
![]()
![]()
![]()
![]()
![]()
![]()
![]()
![]()
![]()
![]()
![]()
![]()
![]()
![]()
![]()
![]()
![]()
![]()
![]()
![]()
![]()
![]()
![]()
![]()
![]()
![]()
![]()
![]()
![]()
![]()
![]()
![]()
![]()
![]()
![]()
![]()
![]()
![]()
![]()
![]()
![]()
![]()
![]()
![]()
![]()
![]()
![]()
![]()
![]()
![]()
![]()
![]()
![]()
![]()
![]()
![]()
![]()
![]()
![]()
![]()
![]()
![]()
![]()
![]()
![]()
![]()
![]()
![]()
![]()
![]()
![]()
![]()
![]()
![]()
![]()
![]()
![]()
![]()
![]()
![]()
![]()
![]()
![]()
![]()
![]()
![]()
![]()
![]()
![]()
![]()
![]()
![]()
![]()
![]()
![]()
![]()
![]()
![]()
![]()
![]()
![]()
![]()
![]()
![]()
![]()
![]()
![]()
![]()
![]()
![]()
![]()
![]()
![]()
![]()
![]()
![]()
![]()
![]()
![]()
![]()
![]()
![]()
![]()
![]()
![]()
![]()
![]()
![]()
![]()
![]()
![]()
![]()
![]()
![]()
![]()
![]()
![]()
![]()
![]()
![]()
![]()
![]()
![]()
![]()
![]()
![]()
![]()
![]()
![]()
![]()
![]()
![]()
![]()
![]()
![]()
![]()
![]()
![]()
![]()
![]()
![]()
![]()
![]()
![]()
![]()
![]()
![]()
![]()
![]()
![]()
![]()
![]()
![]()
![]()
![]()
![]()
![]()
![]()
![]()
![]()
![]()
![]()
![]()
![]()
![]()
![]()
![]()
![]()
![]()
![]()
![]()
![]()
![]()
![]()
![]()
![]()
![]()
![]()
![]()
![]()
![]()
![]()
![]()
![]()
![]()
![]()
![]()
![]()
![]()
![]()
![]()
![]()
![]()
![]()
![]()
![]()
![]()
![]()
![]()
![]()
![]()
![]()
![]()
![]()
![]()
![]()
![]()
![]()
![]()
![]()
![]()
![]()
![]()
![]()
![]()
![]()
![]()
![]()
![]()
![]()
![]()
![]()
![]()
![]()
![]()
![]()
![]()
![]()
![]()
![]()
![]()
![]()
![]()
![]()
![]()
![]()
![]()
![]()
![]()
![]()
![]()
![]()
![]()
![]()
![]()
![]()
![]()
![]()
![]()
![]()
![]()
![]()
![]()
![]()
![]()
![]()
![]()
![]()
![]()
![]()
![]()
![]()
![]()
![]()
![]()
![]()
![]()
![]()
![]()
![]()
![]()
![]()
![]()
![]()
![]()
![]()
![]()
![]()
![]()
![]()
![]()
![]()
![]()
![]()
![]()
![]()
![]()
![]()
![]()
![]()
![]()
![]()
![]()
![]()
![]()
![]()
![]()
![]()
![]()
![]()
![]()
![]()
![]()
![]()
![]()
![]()
![]()
![]()
![]()
![]()
![]()
![]()
![]()
![]()
![]()
![]()
![]()
![]()
![]()
![]()
![]()
![]()
![]()
![]()
![]()
![]()
![]()
![]()
![]()
![]()
![]()
![]()
![]()
![]()
![]()
![]()
![]()
![]()
![]()
![]()
![]()
![]()
![]()
![]()
![]()
![]()
![]()
![]()
![]()
![]()
![]()
![]()
![]()
![]()
![]()
![]()
![]()
![]()
![]()
![]()
![]()
![]()
![]()
![]()
![]()
![]()
![]() Ceramium
Ceramium ![]() Coralina
Coralina
![]()
![]()
![]()
![]()
![]()
![]()
![]()
![]()
![]()
![]()
![]()
![]()
![]()
![]()
![]()
![]()
![]()
![]()
![]()
![]()
![]()
![]()
![]()
![]()
![]()
![]()
![]()
![]()
![]()
![]()
![]()
![]()
![]()
![]()
![]()
![]()
![]()
![]()
![]()
![]()
![]()
![]()
![]()
![]()
![]()
![]()
![]()
![]()
![]()
![]()
![]()
![]()
![]()
![]()
![]()
![]()
![]()
![]()
![]()
![]()
![]()
![]()
![]()
![]()
![]()
![]()
![]()
![]()
![]()
![]()
![]()
![]()
![]()
![]()
![]()
![]()
![]()
![]()
![]()
![]()
![]()
![]()
![]()
![]()
![]()
![]()
![]()
![]()
![]()
![]()
![]()
![]()
![]()
![]()
![]()
![]()
![]()
![]()
![]()
![]()
![]()
![]()
![]()
![]()
![]()
![]()
![]()
![]()
![]()
![]()
![]()
![]()
![]()
![]()
![]()
![]()
![]()
![]()
![]()
![]()
![]()
![]()
![]()
![]()
![]()
![]()
![]()
![]()
![]()
![]()
![]()
![]()
![]()
![]()
![]()
![]()
![]()
![]()
![]()
![]()
![]()
![]()
![]()
![]()
![]()
![]()
![]()
![]()
![]()
![]()
![]()
![]()
![]()
![]()
![]()
![]()
![]()
![]()
![]()
![]()
![]()
![]()
![]()
![]()
![]()
![]()
![]()
![]()
![]()
![]()
![]()
![]()
![]()
![]()
![]()
![]()
![]()
![]()
![]()
![]()
![]()
![]()
![]()
![]()
![]()
![]()
![]()
![]()
![]()
![]()
![]()
![]()
![]()
![]()
![]()
![]()
![]()
![]()
![]()
![]()
![]()
![]()
![]()
![]()
![]()
![]()
![]()
![]()
![]()
![]()
![]()
![]()
![]()
![]()
![]()
![]()
![]()
![]()
![]()
![]()
![]()
![]()
![]()
![]()
![]()
![]()
![]()
![]()
![]()
![]()
![]()
![]()
![]()
![]()
![]()
![]()
![]()
![]()
![]()
![]()
![]()
![]()
![]()
![]()
![]()
![]()
![]()
![]()
![]()
![]()
![]()
![]()
![]()
![]()
![]()
![]()
![]()
![]()
![]()
![]()
![]()
![]()
![]()
![]()
![]()
![]()
![]()
![]()
![]()
![]()
![]()
![]()
![]()
![]()
![]()
![]()
![]()
![]()
![]()
![]()
![]()
![]()
![]()
![]()
![]()
![]()
![]()
![]()
![]()
![]()
![]()
![]()
![]()
![]()
![]()
![]()
![]()
![]()
![]()
![]()
![]()
![]()
![]()
![]()
![]()
![]()
![]()
![]()
![]()
![]()
![]()
![]()
![]()
![]()
![]()
![]()
![]()
![]()
![]()
![]()
![]()
![]()
![]()
![]()
![]()
![]()
![]()
![]()
![]()
![]()
![]()
![]()
![]()
![]()
![]()
![]()
![]()
![]()
![]()
![]()
![]()
![]()
![]()
![]()
![]()
![]()
![]()
![]()
![]()
![]()
![]()
![]()
![]()
![]()
![]()
![]()
![]()
![]()
![]()
![]()
![]()
![]()
![]()
![]()
![]()
![]()
![]()
![]()
![]()
![]()
![]()
![]()
![]()
![]()
![]()
![]()
![]()
![]()
![]()
![]()
![]()
![]()
![]()
![]()
![]()
![]()
![]()
![]()
![]()
![]()
![]()
![]()
![]()
![]()
![]()
![]()
![]()
![]()
![]()
![]()
![]()
![]()
![]()
![]()
![]()
![]()
![]()
![]()
![]()
![]()
![]()
![]()
![]()
![]()
![]()
![]()
![]()
![]()
![]()
![]()
![]()
![]()
![]()
![]()
![]()
![]()
![]()
![]()
![]()
![]()
![]()
![]()
![]()
![]()
![]()
![]()
![]()
![]()
![]()
![]()
![]()
![]()
![]()
![]()
![]()
![]()
![]()
![]()
![]()
![]()
![]()
![]()
![]()
![]()
![]()
![]()
![]()
![]()
![]()
![]()
![]()
![]()
![]()
![]()
![]()
![]()
![]()
![]()
![]()
![]()
![]()
![]()
![]()
![]()
![]()
![]()
![]()
![]()
![]()
![]()
![]()
![]()
![]()
![]()
![]()
![]()
![]()
![]()
![]()
![]()
![]()
![]()
![]()
![]()
![]()
![]()
![]()
![]()
![]()
![]()
![]()
![]()
![]()
![]()
![]()
![]()
![]()
![]()
![]()
![]()
![]()
![]()
![]()
![]()
![]()
![]()
![]()
![]()
![]()
![]()
![]()
![]()
![]()
![]()
![]()
![]()
![]()
![]()
![]()
![]()
![]()
![]()
![]()
![]()
![]()
![]()
![]()
![]()
![]()
![]()
![]()
![]()
![]()
![]()
![]()
![]()
![]()
![]()
![]()
![]()
![]()
![]()
![]()
![]()
![]()
![]()
![]()
![]()
![]()
![]()
![]()
![]()
![]()
![]()
![]()
![]()
![]()
![]()
![]()
![]()
![]()
![]()
![]()
![]()
![]()
![]()
![]()
![]()
![]()
![]()
![]()
![]()
![]()
![]()
![]()
![]()
![]()
![]()
![]()
![]()
![]()
![]()
![]()
![]()
![]()
![]()
![]()
![]()
![]()
![]()
![]()
![]()
![]()
![]()
![]()
![]()
![]()
![]()
![]()
![]()
![]()
![]()
![]()
![]()
![]()
![]()
![]()
![]()
![]()
![]()
![]()
![]()
![]()
![]()
![]()
![]()
![]()
![]()
![]()
![]()
![]()
![]()
![]()
![]()
![]()
![]()
![]()
![]()
![]()
![]()
![]()
![]()
![]()
![]()
![]()
![]()
![]()
![]()
![]()
![]()
![]()
![]()
![]()
![]()
![]()
![]()
![]()
![]()
![]()
![]()
![]()
![]()
![]()
![]()
![]()
![]()
![]()
![]()
![]()
![]()
![]()
![]()
![]()
![]()
![]()
![]()
![]()
![]()
![]()
![]()
![]()
![]()
![]()
![]()
![]()
![]()
![]()
![]()
![]()
![]()
![]()
![]()
![]()
![]()
![]()
![]()
![]()
![]()
![]()
![]()
![]()
![]()
![]()
![]()
![]()
![]()
![]()
![]()
![]()
![]()
![]()
![]()
![]()
![]()
![]()
![]()
![]()
![]()
![]()
![]()
![]()
![]()
![]()
![]()
![]()
![]()
![]()
![]()
![]()
![]()
![]()
![]()
![]()
![]()
![]()
![]()
![]()
![]()
![]()
![]()
![]()
![]()
![]()
![]()
![]()
![]()
![]()
![]()
![]()
![]()
![]()
![]()
![]()
![]()
![]()
![]()
![]()
![]()
![]()
![]()
![]()
![]()
![]()
![]()
![]()
![]()
![]()
![]()
![]()
![]()
![]()
![]()
![]()
![]()
![]()
![]()
![]()
![]()
![]()
![]()
![]()
![]()
![]()
![]()
![]()
![]()
![]()
![]()
![]()
![]()
![]()
![]()
![]()
![]()
![]()
![]()
![]()
![]()
![]()
![]()
![]()
![]()
![]()
![]()
![]()
![]()
![]()
![]()
![]()
![]()
![]()
![]()
![]()
![]()
![]()
![]()
![]()
![]()
![]()
![]()
![]()
![]()
![]()
![]()
![]()
![]()
![]()
![]()
![]()
![]()
![]()
![]()
![]()
![]()
![]()
![]()
![]()
![]()
![]()
![]()
![]()
![]()
![]()
![]()
![]()
![]()
![]()
![]()
![]()
![]()
![]()
![]()
![]()
![]()
![]()
![]()
![]()
![]()
![]()
![]()
![]()
![]()
![]()
![]()
![]()
![]()
![]()
![]()
![]()
![]()
![]()
![]()
![]()
![]()
![]()
![]()
![]()
![]()
![]()
![]()
![]()
![]()
![]()
![]()
![]()
![]()
![]()
![]()
![]()
![]()
![]()
![]()
![]()
![]()
![]()
![]()
![]()
![]()
![]()
![]()
![]()
![]()
![]()
![]()
![]()
![]()
![]()
![]()
![]()
![]()
![]()
![]()
![]()
![]()
![]()
![]()
![]()
![]()
![]()
![]()
![]()
![]()
![]()
![]()
![]()
![]()
![]()
![]()
![]()
![]()
![]()
![]()
![]()
![]()
![]()
![]()
![]()
![]()
![]()
![]()
![]()
![]()
![]()
![]()
![]()
![]()
![]()
![]()
![]()
![]()
![]()
![]()
![]()
![]()
![]()
![]()
![]()
![]()
![]()
![]()
![]()
![]()
![]()
![]()
![]()
![]()
![]()
![]()
![]()
![]()
![]()
![]()
![]()
![]()
![]()
![]()
![]()
![]()
![]()
![]()
![]()
![]()
![]()
![]()
![]()
![]()
![]()
![]()
![]()
![]()
![]()
![]()
![]()
![]()
![]()
![]()
![]()
![]()
![]()
![]()
![]()
![]()
![]()
![]()
![]()
![]()
![]()
![]()
![]()
![]()
![]()
![]()
![]()
![]()
![]()
![]()
![]()
![]()
![]()
![]()
![]()
![]()
![]()
![]()
![]()
![]()
![]()
![]()
![]()
![]()
![]()
![]()
![]()
![]()
![]()
![]()
![]()
![]()
![]()
![]()
![]()
![]()
![]()
![]()
![]()
![]()
![]()
![]()
![]()
![]()
![]()
![]()
![]()
![]()
![]()
![]()
![]()
![]()
![]()
![]()
![]()
![]()
![]()
![]()
![]()
![]()
![]()
![]()
![]()
![]()
![]()
![]()
![]()
![]()
![]()
![]()
![]()
![]()
![]()
![]()
![]()
![]()
![]()
![]()
![]()
![]()
![]()
![]()
![]()
![]()
![]()
![]()
![]()
![]()
![]()
![]()
![]()
![]()
![]()
![]()
![]()
![]()
![]()
![]()
![]()
![]()
![]()
![]()
![]()
![]()
![]()
![]()
![]()
![]()
![]()
![]()
![]()
![]()
![]()
![]()
![]()
![]()
![]()
![]()
![]()
![]()
![]()
![]()
![]()
![]()
![]()
![]()
![]()
![]()
![]()
![]()
![]()
![]()
![]()
![]()
![]()
![]()
![]()
![]()
![]()
![]()
![]()
![]()
![]()
![]()
![]()
![]()
![]()
![]()
![]()
![]()
![]()
![]()
![]()
![]()
![]()
![]()
![]()
![]()
![]()
![]()
![]()
![]()
![]()
![]()
![]()
![]()
![]()
![]()
![]()
![]()
![]()
![]()
![]()
![]()
![]()
![]()
![]()
![]()
![]()
![]()
![]()
![]()
![]()
![]()
![]()
![]()
![]()
![]()
![]()
![]()
![]()
![]()
![]()
![]()
![]()
![]()
![]()
![]()
![]()
![]()
![]()
![]()
![]()
![]()
![]()
![]()
![]()
![]()
![]()
![]()
![]()
![]()
![]()
![]()
![]()
![]()
![]()
![]()
![]()
![]()
![]()
![]()
![]()
![]()
![]()
![]()
![]()
![]()
![]()
![]()
![]()
![]()
![]()
![]()
![]()
![]()
![]()
![]()
![]()
![]()
![]()
![]()
![]()
![]()
![]()
![]()
![]()
![]()
![]()
![]()
![]()
![]()
![]()
![]()
![]()
![]()
![]()
![]()
![]()
![]()
![]()
![]()
![]()
![]()
![]()
![]()
![]()
![]()
![]()
![]()
![]()
![]()
![]()
![]()
![]()
![]()
![]()
![]()
![]()
![]()
![]()
![]()
![]()
![]()
![]()
![]()
![]()
![]()
![]()
![]()
![]()
![]()
![]()
![]()
![]()
![]()
![]()
![]()
![]()
![]()
![]()
![]()
![]()
![]()
![]()
![]()
![]()
![]()
![]()
![]()
![]()
![]()
![]()
![]()
![]()
![]()
![]()
![]()
![]()
![]()
![]()
![]()
![]()
![]()
![]()
![]()
![]()
![]()
![]()
![]()
![]()
![]()
![]()
![]()
![]()
![]()
![]()
![]()
![]()
![]()
![]()
![]()
![]()
![]()
![]()
![]()
![]()
![]()
![]()
![]()
![]()
![]()
![]()
![]()
![]()
![]()
![]()
![]()
![]()
![]()
![]()
![]()
![]()
![]()
![]()
![]()
![]()
![]()
![]()
![]()
![]()
![]()
![]()
![]()
![]()
![]()
![]()
![]()
![]()
![]()
![]()
![]()
![]()
![]()
![]()
![]()
![]()
![]()
![]()
![]()
![]()
![]()
![]()
![]()
![]()
![]()
![]()
![]()
![]()
![]()
![]()
![]()
![]()
![]()
![]()
![]()
![]()
![]()
![]()
![]()
![]()
![]()
![]()
![]()
![]()
![]()
![]()
![]()
![]()
![]()
![]()
![]()
![]()
![]()
![]()
![]()
![]()
![]()
![]()
![]()
![]()
![]()
![]()
![]()
![]()
![]()
![]()
![]()
![]()
![]()
![]()
![]()
![]()
![]()
![]()
![]()
![]()
![]()
![]()
![]()
![]()
![]()
![]()
![]()
![]()
![]()
![]()
![]()
![]()
![]()
![]()
![]()
![]()
![]()
![]()
![]()
![]()
![]()
![]()
![]()
![]()
![]()
![]()
![]()
![]()
![]()
![]()
![]()
![]()
![]()
![]()
![]()
![]()
![]()
![]()
![]()
![]()
![]()
![]()
![]()
![]()
![]()
![]()
![]()
![]()
![]()
![]()
![]()
![]()
![]()
![]()
![]()
![]()
![]()
![]()
![]()
![]()
![]()
![]()
![]()
![]()
![]()
![]()
![]()
![]()
![]()
![]()
![]()
![]()
![]()
![]()
![]()
![]()
![]()
![]()
![]()
![]()
![]()
![]()
![]()
![]()
![]()
![]()
![]()
![]()
![]()
![]()
![]()
![]()
![]()
![]()
![]()
![]()
![]()
![]()
![]()
![]()
![]()
![]()
![]()
![]()
![]()
![]()
![]()
![]()
![]()
![]()
![]()
![]()
![]()
![]()
![]()
![]()
![]()
![]()
![]()
![]()
![]()
![]()
![]()
![]()
![]()
![]()
![]()
![]()
![]()
![]()
![]()
![]()
![]()
![]()
![]()
![]()
![]()
![]()
![]()
![]()
![]()
![]()
![]()
![]()
![]()
![]()
![]()
![]()
![]()
![]()
![]()
![]()
![]()
![]()
![]()
![]()
![]()
![]()
![]()
![]()
![]()
![]()
![]()
![]()
![]()
![]()
![]()
![]()
![]()
![]()
![]()
![]()
![]()
![]()
![]()
![]()
![]()
![]()
![]()
![]()
![]()
![]()
![]()
![]()
![]()
![]()
![]()
![]()
![]()
![]()
![]()
![]()
![]()
![]()
![]()
![]()
![]()
![]()
![]()
![]()
![]()
![]()
![]()
![]()
![]()
![]()
![]()
![]()
![]()
![]()
![]()
![]()
![]()
![]()
![]()
![]()
![]()
![]()
![]()
![]()
![]()
![]()
![]()
![]()
![]()
![]()
![]()
![]()
![]()
![]()
![]()
![]()
![]()
![]()
![]()
![]()
![]() nodulosum officinalis Ceramium 50 LaUcltvuac a 10% nod-u1lo%sum
nodulosum officinalis Ceramium 50 LaUcltvuac a 10% nod-u1lo%sum
![]()
![]()
![]()
![]()
![]()
![]()
![]()
![]()
![]()
![]()
![]()
![]()
![]()
![]()
![]()
![]()
![]()
![]()
![]()
![]()
![]()
![]()
![]()
![]()
![]()
![]()
![]()
![]()
![]()
![]()
![]()
![]()
![]()
![]()
![]()
![]()
![]()
![]()
![]()
![]()
![]()
![]()
![]()
![]()
![]()
![]()
![]()
![]()
![]()
![]()
![]()
![]()
![]()
![]()
![]()
![]()
![]()
![]()
![]()
![]()
![]()
![]()
![]()
![]()
![]()
![]()
![]()
![]()
![]()
![]()
![]()
![]()
![]()
![]()
![]()
![]()
![]()
![]()
![]()
![]()
![]()
![]()
![]()
![]()
![]()
![]()
![]()
![]()
![]()
![]()
![]()
![]()
![]()
![]()
![]()
![]()
![]()
![]()
![]()
![]()
![]()
![]()
![]()
![]()
![]()
![]()
![]()
![]()
![]()
![]()
![]()
![]()
![]()
![]()
![]()
![]()
![]()
![]()
![]()
![]()
![]()
![]()
![]()
![]()
![]()
![]()
![]()
![]()
![]()
![]()
![]()
![]()
![]()
![]()
![]()
![]()
![]()
![]()
![]()
![]()
![]()
![]()
![]()
![]()
![]()
![]()
![]()
![]()
![]()
![]()
![]()
![]()
![]()
![]()
![]()
![]()
![]()
![]()
![]()
![]()
![]()
![]()
![]()
![]()
![]()
![]()
![]()
![]()
![]()
![]()
![]()
![]()
![]()
![]()
![]()
![]()
![]()
![]()
![]()
![]()
![]()
![]()
![]()
![]()
![]()
![]()
![]()
![]()
![]()
![]()
![]()
![]()
![]()
![]()
![]()
![]()
![]()
![]()
![]()
![]()
![]()
![]()
![]()
![]()
![]()
![]()
![]()
![]()
![]()
![]()
![]()
![]()
![]()
![]()
![]()
![]()
![]()
![]()
![]()
![]()
![]()
![]()
![]()
![]()
![]()
![]()
![]()
![]()
![]()
![]()
![]()
![]()
![]()
![]()
![]()
![]()
![]()
![]()
![]()
![]()
![]()
![]()
![]()
![]()
![]()
![]()
![]()
![]()
![]()
![]()
![]()
![]()
![]()
![]()
![]()
![]()
![]()
![]()
![]()
![]()
![]()
![]()
![]()
![]()
![]()
![]()
![]()
![]()
![]()
![]()
![]()
![]()
![]()
![]()
![]()
![]()
![]()
![]()
![]()
![]()
![]()
![]()
![]()
![]()
![]()
![]()
![]()
![]()
![]()
![]()
![]()
![]()
![]()
![]()
![]()
![]()
![]()
![]()
![]()
![]()
![]()
![]()
![]()
![]()
![]()
![]()
![]()
![]()
![]()
![]()
![]()
![]()
![]()
![]()
![]()
![]()
![]()
![]()
![]()
![]()
![]()
![]()
![]()
![]()
![]()
![]()
![]()
![]()
![]()
![]()
![]()
![]()
![]()
![]()
![]()
![]()
![]()
![]()
![]()
![]()
![]()
![]()
![]()
![]()
![]()
![]()
![]()
![]()
![]()
![]()
![]()
![]()
![]()
![]()
![]()
![]()
![]()
![]()
![]()
![]()
![]()
![]()
![]()
![]()
![]()
![]()
![]()
![]()
![]()
![]()
![]()
![]()
![]()
![]()
![]()
![]()
![]()
![]()
![]()
![]()
![]()
![]()
![]()
![]()
![]()
![]()
![]()
![]()
![]()
![]()
![]()
![]()
![]()
![]()
![]()
![]()
![]()
![]()
![]()
![]()
![]()
![]()
![]()
![]()
![]()
![]()
![]()
![]()
![]()
![]()
![]()
![]()
![]()
![]()
![]()
![]()
![]()
![]()
![]()
![]()
![]()
![]()
![]()
![]()
![]()
![]()
![]()
![]()
![]()
![]()
![]()
![]()
![]()
![]()
![]()
![]()
![]()
![]()
![]()
![]()
![]()
![]()
![]()
![]()
![]()
![]()
![]()
![]()
![]()
![]()
![]()
![]()
![]()
![]()
![]()
![]()
![]()
![]()
![]()
![]()
![]()
![]()
![]()
![]()
![]()
![]()
![]()
![]()
![]()
![]()
![]()
![]()
![]()
![]()
![]()
![]()
![]()
![]()
![]()
![]()
![]()
![]()
![]()
![]()
![]()
![]()
![]()
![]()
![]()
![]()
![]()
![]()
![]()
![]()
![]()
![]()
![]()
![]()
![]()
![]()
![]()
![]()
![]()
![]()
![]()
![]()
![]()
![]()
![]()
![]()
![]()
![]()
![]()
![]()
![]()
![]()
![]()
![]()
![]()
![]()
![]()
![]()
![]()
![]()
![]()
![]()
![]()
![]()
![]()
![]()
![]()
![]()
![]()
![]()
![]()
![]()
![]()
![]()
![]()
![]()
![]()
![]()
![]()
![]()
![]()
![]()
![]()
![]()
![]()
![]()
![]()
![]()
![]()
![]()
![]()
![]()
![]()
![]()
![]()
![]()
![]()
![]()
![]()
![]()
![]()
![]()
![]()
![]()
![]()
![]()
![]()
![]()
![]()
![]()
![]()
![]()
![]()
![]()
![]()
![]()
![]()
![]()
![]()
![]()
![]()
![]()
![]()
![]()
![]()
![]()
![]()
![]()
![]()
![]()
![]()
![]()
![]()
![]()
![]()
![]()
![]()
![]()
![]()
![]()
![]()
![]()
![]()
![]()
![]()
![]()
![]()
![]()
![]()
![]()
![]()
![]()
![]()
![]()
![]()
![]()
![]()
![]()
![]()
![]()
![]()
![]()
![]()
![]()
![]()
![]()
![]()
![]()
![]()
![]()
![]()
![]()
![]()
![]()
![]()
![]()
![]()
![]()
![]()
![]()
![]()
![]()
![]()
![]()
![]()
![]()
![]()
![]()
![]()
![]()
![]()
![]()
![]()
![]()
![]()
![]()
![]()
![]()
![]()
![]()
![]()
![]()
![]()
![]()
![]()
![]()
![]()
![]()
![]()
![]()
![]()
![]()
![]()
![]()
![]()
![]()
![]()
![]()
![]()
![]()
![]()
![]()
![]()
![]()
![]()
![]()
![]()
![]()
![]()
![]()
![]()
![]()
![]()
![]()
![]()
![]()
![]()
![]()
![]()
![]()
![]()
![]()
![]()
![]()
![]()
![]()
![]()
![]()
![]()
![]()
![]()
![]()
![]()
![]()
![]()
![]()
![]()
![]()
![]()
![]()
![]()
![]()
![]()
![]()
![]()
![]()
![]()
![]()
![]()
![]()
![]()
![]()
![]()
![]()
![]()
![]()
![]()
![]()
![]()
![]()
![]()
![]()
![]()
![]()
![]()
![]()
![]()
![]()
![]()
![]()
![]()
![]()
![]()
![]()
![]()
![]()
![]()
![]()
![]()
![]()
![]()
![]()
![]()
![]()
![]()
![]()
![]()
![]()
![]()
![]()
![]()
![]()
![]()
![]()
![]()
![]()
![]()
![]()
![]()
![]()
![]()
![]()
![]()
![]()
![]()
![]()
![]()
![]()
![]()
![]()
![]()
![]()
![]()
![]()
![]()
![]()
![]()
![]()
![]()
![]()
![]()
![]()
![]()
![]()
![]()
![]()
![]()
![]()
![]()
![]()
![]()
![]()
![]()
![]()
![]()
![]()
![]()
![]()
![]()
![]()
![]()
![]()
![]()
![]()
![]()
![]()
![]()
![]()
![]()
![]()
![]()
![]()
![]()
![]()
![]()
![]()
![]()
![]()
![]()
![]()
![]()
![]()
![]()
![]()
![]()
![]()
![]()
![]()
![]()
![]()
![]()
![]()
![]()
![]()
![]()
![]()
![]()
![]()
![]()
![]()
![]()
![]()
![]()
![]()
![]()
![]()
![]()
![]()
![]()
![]()
![]()
![]()
![]()
![]()
![]()
![]()
![]()
![]()
![]()
![]()
![]()
![]() Chaetomor 0.5
Chaetomor 0.5 ![]() Cladophor
Cladophor ![]() pha linum
pha linum ![]() a rupestris
a rupestris
![]()
![]()
![]()
![]()
![]()
![]()
![]()
![]()
![]()
![]()
![]()
![]()
![]()
![]()
![]()
![]()
![]()
![]()
![]()
![]()
![]()
![]()
![]()
![]()
![]()
![]()
![]()
![]()
![]()
![]()
![]()
![]()
![]()
![]()
![]()
![]()
![]()
![]()
![]()
![]()
![]()
![]()
![]()
![]()
![]()
![]()
![]()
![]()
![]()
![]()
![]()
![]()
![]()
![]()
![]()
![]()
![]()
![]()
![]()
![]()
![]()
![]()
![]()
![]()
![]()
![]()
![]()
![]()
![]()
![]()
![]()
![]()
![]()
![]()
![]()
![]()
![]()
![]()
![]()
![]()
![]()
![]()
![]()
![]()
![]()
![]()
![]()
![]()
![]()
![]()
![]()
![]()
![]()
![]()
![]()
![]()
![]()
![]()
![]()
![]()
![]()
![]()
![]()
![]()
![]()
![]()
![]()
![]()
![]()
![]()
![]()
![]()
![]()
![]()
![]()
![]()
![]()
![]()
![]()
![]()
![]()
![]()
![]()
![]()
![]()
![]()
![]()
![]()
![]()
![]()
![]()
![]()
![]()
![]()
![]()
![]()
![]()
![]()
![]()
![]()
![]()
![]()
![]()
![]()
![]()
![]()
![]()
![]()
![]()
![]()
![]()
![]() 10
10 ![]() 10%
10%
![]()
![]()
![]()
![]()
![]()
![]()
![]()
![]()
![]()
![]()
![]()
![]()
![]()
![]()
![]()
![]()
![]()
![]()
![]()
![]()
![]()
![]()
![]()
![]()
![]()
![]()
![]()
![]()
![]()
![]()
![]()
![]()
![]()
![]()
![]()
![]()
![]()
![]()
![]()
![]()
![]()
![]()
![]()
![]()
![]()
![]()
![]()
![]()
![]()
![]()
![]()
![]()
![]()
![]()
![]()
![]()
![]()
![]()
![]()
![]()
![]()
![]()
![]()
![]()
![]()
![]()
![]()
![]()
![]()
![]()
![]()
![]()
![]()
![]()
![]()
![]()
![]()
![]()
![]()
![]()
![]()
![]()
![]()
![]()
![]()
![]()
![]()
![]()
![]()
![]()
![]()
![]()
![]()
![]()
![]()
![]()
![]()
![]()
![]()
![]()
![]()
![]()
![]()
![]()
![]()
![]()
![]()
![]()
![]()
![]()
![]()
![]()
![]()
![]()
![]()
![]()
![]()
![]()
![]()
![]()
![]()
![]()
![]()
![]()
![]()
![]()
![]()
![]()
![]()
![]()
![]()
![]()
![]()
![]()
![]()
![]()
![]()
![]()
![]()
![]()
![]()
![]()
![]()
![]()
![]()
![]()
![]()
![]()
![]()
![]()
![]()
![]()
![]()
![]()
![]()
![]()
![]()
![]()
![]()
![]()
![]()
![]()
![]()
![]()
![]()
![]()
![]()
![]()
![]()
![]()
![]()
![]()
![]()
![]()
![]()
![]()
![]()
![]()
![]()
![]()
![]()
![]()
![]()
![]()
![]()
![]()
![]()
![]()
![]()
![]()
![]()
![]()
![]()
![]()
![]()
![]()
![]()
![]()
![]()
![]()
![]()
![]()
![]()
![]()
![]()
![]()
![]()
![]()
![]()
![]()
![]()
![]()
![]()
![]()
![]()
![]()
![]()
![]()
![]()
![]()
![]()
![]()
![]()
![]()
![]()
![]()
![]()
![]()
![]()
![]()
![]()
![]()
![]()
![]()
![]()
![]()
![]()
![]()
![]()
![]()
![]()
![]()
![]()
![]()
![]()
![]()
![]()
![]()
![]()
![]()
![]()
![]()
![]()
![]()
![]()
![]()
![]()
![]()
![]()
![]()
![]()
![]()
![]()
![]()
![]()
![]()
![]()
![]()
![]()
![]()
![]()
![]()
![]()
![]()
![]()
![]()
![]()
![]()
![]()
![]()
![]()
![]()
![]()
![]()
![]()
![]()
![]()
![]()
![]()
![]()
![]()
![]()
![]()
![]()
![]()
![]()
![]()
![]()
![]()
![]() c) d)
c) d)
![]()
![]()
![]()
![]()
![]()
![]()
![]()
![]()
![]()
![]()
![]()
![]()
![]()
![]()
![]()
![]()
![]()
![]()
![]()
![]()
![]()
![]()
![]()
![]()
![]()
![]()
![]()
![]()
![]()
![]()
![]()
![]()
![]()
![]()
![]()
![]()
![]()
![]()
![]()
![]()
![]()
![]()
![]()
![]()
![]()
![]()
![]()
![]()
![]()
![]()
![]()
![]()
![]()
![]()
![]()
![]()
![]()
![]()
![]()
![]()
![]()
![]()
![]()
![]()
![]()
![]()
![]()
![]()
![]()
![]()
![]()
![]()
![]()
![]()
![]()
![]()
![]()
![]()
![]()
![]()
![]()
![]()
![]()
![]()
![]()
![]()
![]()
![]()
![]()
![]()
![]()
![]()
![]()
![]()
![]()
![]()
![]()
![]()
![]()
![]()
![]()
![]()
![]()
![]()
![]()
![]()
![]()
![]()
![]()
![]()
![]()
![]()
![]()
![]()
![]()
![]()
![]()
![]()
![]()
![]()
![]()
![]()
![]()
![]()
![]()
![]()
![]()
![]()
![]()
![]()
![]()
![]()
![]()
![]()
![]()
![]()
![]()
![]()
![]()
![]()
![]()
![]()
![]()
![]()
![]()
![]()
![]()
![]()
![]()
![]()
![]()
![]()
![]()
![]()
![]()
![]()
![]()
![]()
![]()
![]()
![]()
![]()
![]()
![]()
![]()
![]()
![]()
![]()
![]()
![]()
![]()
![]()
![]()
![]()
![]()
![]()
![]()
![]()
![]()
![]()
![]()
![]()
![]()
![]()
![]()
![]()
![]()
![]()
![]()
![]()
![]()
![]()
![]()
![]()
![]()
![]()
![]()
![]()
![]()
![]()
![]()
![]()
![]()
![]()
![]()
![]()
![]()
![]()
![]()
![]()
![]()
![]()
![]()
![]()
![]()
![]()
![]()
![]()
![]()
![]()
![]()
![]()
![]()
![]()
![]()
![]()
![]()
![]()
![]()
![]()
![]()
![]()
![]()
![]()
![]()
![]()
![]()
![]()
![]()
![]()
![]()
![]()
![]()
![]()
![]()
![]()
![]()
![]()
![]()
![]()
![]()
![]()
![]()
![]()
![]()
![]()
![]()
![]()
![]()
![]() No No
No No
![]()
![]()
![]()
![]()
![]()
![]()
![]()
![]()
![]()
![]()
![]()
![]()
![]()
![]()
![]()
![]()
![]()
![]()
![]()
![]()
![]()
![]()
![]()
![]()
![]()
![]()
![]()
![]()
![]()
![]()
![]()
![]()
![]()
![]()
![]()
![]()
![]()
![]()
![]()
![]()
![]()
![]()
![]()
![]()
![]()
![]()
![]()
![]()
![]()
![]()
![]()
![]()
![]()
![]()
![]()
![]()
![]()
![]()
![]()
![]()
![]()
![]()
![]()
![]()
![]()
![]()
![]()
![]()
![]()
![]()
![]()
![]()
![]()
![]()
![]()
![]()
![]()
![]()
![]()
![]()
![]()
![]()
![]()
![]()
![]()
![]()
![]()
![]()
![]()
![]()
![]()
![]()
![]()
![]()
![]()
![]()
![]()
![]()
![]()
![]()
![]()
![]()
![]()
![]()
![]()
![]()
![]()
![]()
![]()
![]()
![]()
![]()
![]()
![]()
![]()
![]()
![]()
![]()
![]()
![]()
![]()
![]()
![]()
![]()
![]()
![]()
![]()
![]()
![]()
![]()
![]()
![]()
![]()
![]()
![]()
![]()
![]()
![]()
![]()
![]()
![]()
![]()
![]()
![]()
![]()
![]()
![]()
![]()
![]()
![]()
![]()
![]()
![]()
![]()
![]()
![]()
![]()
![]()
![]()
![]()
![]()
![]()
![]()
![]()
![]()
![]()
![]()
![]()
![]()
![]()
![]()
![]()
![]()
![]()
![]()
![]()
![]()
![]()
![]()
![]()
![]()
![]()
![]()
![]()
![]()
![]()
![]()
![]()
![]()
![]()
![]()
![]()
![]()
![]()
![]()
![]()
![]()
![]()
![]()
![]()
![]()
![]()
![]()
![]()
![]()
![]()
![]()
![]()
![]()
![]()
![]()
![]()
![]()
![]()
![]()
![]()
![]()
![]()
![]()
![]()
![]()
![]()
![]()
![]()
![]()
![]()
![]()
![]()
![]()
![]()
![]()
![]()
![]()
![]()
![]()
![]()
![]()
![]()
![]()
![]()
![]()
![]()
![]()
![]()
![]()
![]()
![]()
![]()
![]()
![]()
![]()
![]()
![]()
![]()
![]()
![]()
![]()
![]()
![]()
![]()
![]()
![]()
![]()
![]()
![]()
![]()
![]()
![]()
![]()
![]()
![]()
![]()
![]()
![]()
![]()
![]()
![]()
![]()
![]()
![]()
![]()
![]()
![]()
![]()
![]()
![]()
![]()
![]()
![]()
![]()
![]()
![]()
![]()
![]()
![]()
![]()
![]()
![]()
![]()
![]()
![]()
![]()
![]()
![]()
![]()
![]()
![]()
![]()
![]()
![]()
![]()
![]()
![]()
![]()
![]()
![]()
![]()
![]()
![]()
![]()
![]()
![]()
![]()
![]()
![]()
![]()
![]()
![]()
![]()
![]()
![]()
![]()
![]()
![]()
![]()
![]()
![]()
![]()
![]()
![]()
![]()
![]()
![]()
![]()
![]()
![]()
![]()
![]()
![]()
![]()
![]()
![]()
![]()
![]()
![]()
![]()
![]()
![]()
![]()
![]()
![]()
![]()
![]()
![]()
![]()
![]()
![]()
![]()
![]()
![]()
![]()
![]()
![]()
![]()
![]()
![]()
![]()
![]()
![]()
![]()
![]()
![]()
![]()
![]()
![]()
![]()
![]()
![]()
![]()
![]()
![]()
![]()
![]()
![]()
![]()
![]()
![]()
![]()
![]()
![]()
![]()
![]()
![]()
![]()
![]()
![]()
![]()
![]()
![]()
![]()
![]()
![]()
![]()
![]()
![]()
![]()
![]()
![]()
![]()
![]()
![]()
![]()
![]()
![]()
![]()
![]()
![]()
![]()
![]()
![]()
![]()
![]()
![]()
![]()
![]()
![]()
![]()
![]()
![]()
![]()
![]()
![]()
![]()
![]()
![]()
![]()
![]()
![]()
![]()
![]()
![]()
![]()
![]()
![]()
![]()
![]()
![]()
![]()
![]()
![]()
![]()
![]()
![]()
![]()
![]()
![]()
![]()
![]()
![]()
![]()
![]()
![]()
![]()
![]()
![]()
![]()
![]()
![]()
![]()
![]()
![]()
![]()
![]()
![]()
![]()
![]()
![]()
![]()
![]()
![]()
![]()
![]()
![]()
![]()
![]()
![]()
![]()
![]()
![]()
![]()
![]()
![]()
![]()
![]()
![]()
![]()
![]()
![]()
![]()
![]()
![]()
![]()
![]()
![]()
![]()
![]()
![]()
![]()
![]()
![]()
![]()
![]()
![]()
![]()
![]()
![]()
![]()
![]()
![]()
![]()
![]()
![]()
![]()
![]()
![]()
![]()
![]()
![]()
![]()
![]()
![]()
![]()
![]()
![]()
![]()
![]()
![]()
![]()
![]()
![]()
![]()
![]()
![]()
![]()
![]()
![]()
![]()
![]()
![]()
![]()
![]()
![]()
![]()
![]()
![]()
![]()
![]()
![]()
![]()
![]()
![]()
![]()
![]()
![]()
![]()
![]()
![]()
![]()
![]()
![]()
![]()
![]()
![]()
![]()
![]()
![]()
![]()
![]()
![]()
![]()
![]()
![]()
![]()
![]()
![]()
![]()
![]()
![]()
![]()
![]()
![]()
![]()
![]()
![]()
![]()
![]()
![]()
![]()
![]()
![]()
![]()
![]() nCoedrmualmosiuu 15% co1ve0r%age Cermamiu
nCoedrmualmosiuu 15% co1ve0r%age Cermamiu
![]()
![]()
![]()
![]()
![]()
![]()
![]()
![]()
![]()
![]()
![]()
![]()
![]()
![]()
![]()
![]()
![]()
![]()
![]()
![]()
![]()
![]()
![]()
![]()
![]()
![]()
![]()
![]()
![]()
![]()
![]()
![]()
![]()
![]()
![]()
![]()
![]()
![]()
![]()
![]()
![]()
![]()
![]()
![]()
![]()
![]()
![]()
![]()
![]()
![]()
![]()
![]()
![]()
![]()
![]()
![]()
![]()
![]()
![]()
![]()
![]()
![]()
![]()
![]()
![]()
![]()
![]()
![]()
![]()
![]()
![]()
![]()
![]()
![]()
![]()
![]()
![]()
![]()
![]()
![]()
![]()
![]()
![]()
![]()
![]()
![]()
![]()
![]()
![]()
![]()
![]()
![]()
![]()
![]()
![]()
![]()
![]()
![]()
![]()
![]()
![]()
![]()
![]()
![]()
![]()
![]()
![]()
![]()
![]()
![]()
![]()
![]()
![]()
![]()
![]()
![]()
![]()
![]()
![]()
![]()
![]()
![]()
![]()
![]()
![]()
![]()
![]()
![]()
![]()
![]()
![]()
![]()
![]()
![]()
![]()
![]()
![]()
![]()
![]()
![]()
![]()
![]()
![]()
![]()
![]()
![]()
![]()
![]()
![]()
![]()
![]()
![]()
![]()
![]()
![]()
![]()
![]()
![]()
![]()
![]()
![]()
![]()
![]()
![]() coverage
coverage
![]()
![]()
![]()
![]()
![]()
![]()
![]()
![]()
![]()
![]()
![]()
![]()
![]()
![]()
![]()
![]()
![]()
![]()
![]()
![]()
![]()
![]()
![]()
![]()
![]()
![]()
![]()
![]()
![]()
![]()
![]()
![]()
![]()
![]()
![]()
![]()
![]()
![]()
![]()
![]()
![]()
![]()
![]()
![]()
![]()
![]()
![]()
![]()
![]()
![]()
![]()
![]()
![]()
![]()
![]()
![]()
![]()
![]()
![]()
![]()
![]()
![]()
![]()
![]()
![]()
![]()
![]()
![]()
![]()
![]()
![]()
![]()
![]()
![]()
![]()
![]()
![]()
![]()
![]()
![]()
![]()
![]()
![]()
![]()
![]()
![]()
![]()
![]()
![]()
![]()
![]()
![]()
![]()
![]()
![]()
![]()
![]()
![]()
![]()
![]()
![]()
![]()
![]()
![]()
![]()
![]()
![]()
![]()
![]()
![]()
![]()
![]()
![]()
![]()
![]()
![]()
![]()
![]()
![]()
![]()
![]()
![]()
![]()
![]()
![]()
![]()
![]()
![]()
![]()
![]()
![]()
![]()
![]()
![]()
![]()
![]()
![]()
![]()
![]()
![]()
![]()
![]()
![]()
![]()
![]()
![]()
![]()
![]()
![]()
![]()
![]()
![]()
![]()
![]()
![]()
![]()
![]()
![]()
![]()
![]()
![]()
![]()
![]()
![]()
![]()
![]()
![]()
![]()
![]()
![]()
![]()
![]()
![]()
![]()
![]()
![]()
![]()
![]()
![]()
![]()
![]()
![]()
![]()
![]()
![]()
![]()
![]()
![]()
![]()
![]()
![]()
![]()
![]()
![]()
![]()
![]()
![]()
![]()
![]()
![]()
![]()
![]()
![]()
![]()
![]()
![]()
![]()
![]()
![]()
![]()
![]()
![]()
![]()
![]()
![]()
![]()
![]()
![]()
![]()
![]()
![]()
![]()
![]()
![]()
![]()
![]()
![]()
![]()
![]()
![]()
![]()
![]()
![]()
![]()
![]()
![]()
![]()
![]()
![]()
![]()
![]()
![]()
![]()
![]()
![]()
![]()
![]()
![]()
![]()
![]()
![]()
![]()
![]()
![]()
![]()
![]()
![]()
![]()
![]()
![]()
![]()
![]()
![]()
![]()
![]()
![]()
![]()
![]()
![]()
![]()
![]()
![]()
![]()
![]()
![]()
![]()
![]()
![]()
![]()
![]()
![]()
![]()
![]()
![]()
![]()
![]()
![]()
![]()
![]()
![]()
![]()
![]()
![]()
![]()
![]()
![]()
![]()
![]()
![]()
![]()
![]()
![]()
![]()
![]()
![]()
![]()
![]()
![]()
![]()
![]()
![]()
![]()
![]()
![]()
![]()
![]()
![]()
![]()
![]()
![]()
![]()
![]()
![]()
![]()
![]()
![]()
![]()
![]()
![]()
![]()
![]()
![]()
![]()
![]()
![]()
![]()
![]()
![]()
![]()
![]()
![]()
![]()
![]()
![]()
![]()
![]()
![]()
![]()
![]()
![]()
![]()
![]()
![]()
![]()
![]()
![]()
![]()
![]()
![]()
![]()
![]()
![]()
![]()
![]()
![]()
![]()
![]()
![]()
![]()
![]()
![]()
![]()
![]()
![]()
![]()
![]()
![]()
![]()
![]()
![]()
![]()
![]()
![]()
![]()
![]()
![]()
![]()
![]()
![]()
![]()
![]()
![]()
![]()
![]()
![]()
![]()
![]()
![]()
![]()
![]()
![]()
![]()
![]()
![]()
![]()
![]()
![]()
![]()
![]()
![]()
![]()
![]()
![]()
![]()
![]()
![]()
![]()
![]()
![]()
![]()
![]()
![]()
![]()
![]()
![]()
![]()
![]()
![]()
![]()
![]()
![]()
![]()
![]()
![]()
![]()
![]()
![]()
![]()
![]()
![]()
![]()
![]()
![]()
![]()
![]()
![]()
![]()
![]()
![]()
![]()
![]()
![]()
![]()
![]()
![]()
![]()
![]()
![]()
![]()
![]()
![]()
![]()
![]()
![]()
![]()
![]()
![]()
![]()
![]()
![]()
![]()
![]()
![]()
![]()
![]()
![]()
![]()
![]()
![]()
![]()
![]()
![]()
![]()
![]()
![]()
![]()
![]()
![]()
![]()
![]()
![]()
![]()
![]()
![]()
![]()
![]()
![]()
![]()
![]()
![]()
![]()
![]()
![]()
![]()
![]()
![]()
![]()
![]()
![]()
![]()
![]()
![]()
![]()
![]()
![]()
![]()
![]()
![]()
![]()
![]()
![]()
![]()
![]()
![]()
![]()
![]()
![]()
![]()
![]()
![]()
![]()
![]()
![]()
![]()
![]()
![]()
![]()
![]()
![]()
![]()
![]()
![]()
![]()
![]()
![]()
![]()
![]()
![]()
![]()
![]()
![]()
![]()
![]()
![]()
![]()
![]()
![]()
![]()
![]()
![]()
![]()
![]()
![]()
![]()
![]()
![]()
![]()
![]()
![]()
![]()
![]()
![]()
![]()
![]()
![]()
![]()
![]()
![]()
![]()
![]()
![]()
![]()
![]()
![]()
![]()
![]()
![]()
![]()
![]()
![]()
![]()
![]()
![]()
![]()
![]()
![]()
![]()
![]()
![]()
![]()
![]()
![]()
![]()
![]()
![]()
![]()
![]()
![]()
![]()
![]()
![]()
![]() m nodulosu 5% m
m nodulosu 5% m
![]()
![]()
![]()
![]()
![]()
![]()
![]()
![]()
![]()
![]()
![]()
![]()
![]()
![]()
![]()
![]()
![]()
![]()
![]()
![]()
![]()
![]()
![]()
![]()
![]()
![]()
![]()
![]()
![]()
![]()
![]()
![]()
![]()
![]()
![]()
![]()
![]()
![]()
![]()
![]()
![]()
![]()
![]()
![]()
![]()
![]()
![]()
![]()
![]()
![]()
![]()
![]()
![]()
![]()
![]()
![]()
![]()
![]()
![]()
![]()
![]()
![]()
![]()
![]()
![]()
![]()
![]()
![]()
![]()
![]()
![]()
![]()
![]()
![]()
![]()
![]()
![]()
![]()
![]()
![]()
![]()
![]()
![]()
![]()
![]()
![]()
![]()
![]()
![]()
![]()
![]()
![]()
![]()
![]()
![]()
![]()
![]()
![]()
![]()
![]()
![]()
![]()
![]()
![]()
![]()
![]()
![]()
![]()
![]()
![]()
![]()
![]()
![]()
![]()
![]()
![]()
![]()
![]()
![]()
![]()
![]()
![]()
![]()
![]()
![]()
![]()
![]()
![]()
![]()
![]()
![]()
![]()
![]()
![]()
![]()
![]()
![]()
![]()
![]()
![]()
![]()
![]()
![]()
![]()
![]()
![]()
![]()
![]()
![]()
![]()
![]()
![]()
![]()
![]()
![]()
![]()
![]()
![]()
![]()
![]()
![]()
![]()
![]()
![]()
![]()
![]()
![]()
![]()
![]()
![]()
![]()
![]()
![]()
![]()
![]()
![]()
![]()
![]()
![]()
![]()
![]()
![]()
![]()
![]()
![]()
![]()
![]()
![]()
![]()
![]()
![]()
![]()
![]()
![]()
![]()
![]()
![]()
![]()
![]()
![]()
![]()
![]()
![]()
![]()
![]()
![]()
![]()
![]()
![]()
![]()
![]()
![]()
![]()
![]()
![]()
![]()
![]()
![]()
![]()
![]()
![]()
![]()
![]()
![]()
![]()
![]()
![]()
![]()
![]()
![]()
![]()
![]()
![]()
![]()
![]()
![]()
![]()
![]()
![]()
![]()
![]()
![]()
![]()
![]()
![]()
![]()
![]()
![]()
![]()
![]()
![]()
![]()
![]()
![]()
![]()
![]()
![]()
![]()
![]()
![]()
![]()
![]()
![]()
![]()
![]()
![]()
![]()
![]()
![]()
![]()
![]()
![]()
![]()
![]()
![]()
![]()
![]()
![]()
![]()
![]()
![]()
![]()
![]()
![]()
![]()
![]()
![]()
![]()
![]()
![]()
![]()
![]()
![]()
![]()
![]()
![]()
![]()
![]()
![]()
![]()
![]()
![]()
![]()
![]()
![]()
![]()
![]()
![]()
![]()
![]()
![]()
![]()
![]()
![]()
![]()
![]()
![]()
![]()
![]()
![]()
![]()
![]()
![]()
![]()
![]()
![]()
![]()
![]()
![]()
![]()
![]()
![]()
![]()
![]()
![]()
![]()
![]()
![]()
![]()
![]()
![]()
![]()
![]()
![]()
![]()
![]()
![]()
![]()
![]()
![]()
![]()
![]()
![]()
![]()
![]()
![]()
![]()
![]()
![]()
![]()
![]()
![]()
![]()
![]()
![]()
![]()
![]()
![]()
![]()
![]()
![]()
![]()
![]()
![]()
![]()
![]()
![]()
![]()
![]()
![]()
![]()
![]()
![]()
![]()
![]()
![]()
![]()
![]()
![]()
![]()
![]()
![]()
![]()
![]()
![]()
![]()
![]()
![]()
![]()
![]()
![]()
![]()
![]()
![]()
![]()
![]()
![]()
![]()
![]()
![]()
![]()
![]()
![]()
![]()
![]()
![]()
![]()
![]()
![]()
![]()
![]()
![]()
![]()
![]()
![]()
![]()
![]()
![]()
![]()
![]()
![]()
![]()
![]()
![]()
![]()
![]()
![]()
![]()
![]()
![]()
![]()
![]()
![]()
![]()
![]()
![]()
![]()
![]()
![]()
![]()
![]()
![]()
![]()
![]()
![]()
![]()
![]()
![]()
![]()
![]()
![]()
![]()
![]()
![]()
![]()
![]()
![]()
![]()
![]()
![]()
![]()
![]()
![]()
![]()
![]()
![]()
![]()
![]()
![]()
![]()
![]()
![]()
![]()
![]()
![]()
![]()
![]()
![]()
![]()
![]()
![]()
![]()
![]()
![]()
![]()
![]()
![]()
![]()
![]()
![]()
![]()
![]()
![]()
![]()
![]()
![]()
![]()
![]()
![]()
![]()
![]()
![]()
![]()
![]()
![]()
![]()
![]()
![]()
![]()
![]()
![]()
![]()
![]()
![]()
![]()
![]()
![]()
![]()
![]()
![]()
![]()
![]()
![]()
![]()
![]()
![]()
![]()
![]()
![]()
![]()
![]()
![]()
![]()
![]()
![]()
![]()
![]()
![]()
![]()
![]()
![]()
![]()
![]()
![]()
![]()
![]()
![]()
![]()
![]()
![]()
![]()
![]()
![]()
![]()
![]()
![]()
![]()
![]()
![]()
![]()
![]()
![]()
![]()
![]()
![]()
![]()
![]()
![]()
![]()
![]()
![]()
![]()
![]()
![]()
![]()
![]()
![]()
![]()
![]()
![]()
![]()
![]()
![]()
![]()
![]()
![]()
![]()
![]()
![]()
![]()
![]()
![]()
![]()
![]()
![]()
![]()
![]()
![]()
![]()
![]()
![]()
![]()
![]()
![]()
![]()
![]()
![]()
![]()
![]()
![]()
![]()
![]()
![]()
![]()
![]()
![]()
![]()
![]()
![]()
![]()
![]()
![]()
![]()
![]()
![]()
![]()
![]()
![]()
![]()
![]()
![]()
![]()
![]()
![]()
![]()
![]()
![]()
![]()
![]()
![]()
![]()
![]()
![]()
![]()
![]()
![]()
![]()
![]()
![]()
![]()
![]()
![]()
![]()
![]()
![]()
![]()
![]()
![]()
![]()
![]()
![]()
![]()
![]()
![]()
![]()
![]()
![]()
![]()
![]()
![]()
![]()
![]()
![]()
![]()
![]()
![]()
![]()
![]()
![]()
![]()
![]()
![]()
![]()
![]()
![]()
![]()
![]()
![]()
![]()
![]()
![]()
![]()
![]()
![]()
![]()
![]()
![]()
![]()
![]()
![]()
![]()
![]()
![]()
![]()
![]()
![]()
![]()
![]()
![]()
![]()
![]()
![]()
![]()
![]()
![]()
![]()
![]()
![]()
![]()
![]()
![]()
![]()
![]()
![]()
![]()
![]()
![]()
![]()
![]()
![]()
![]()
![]()
![]()
![]()
![]()
![]()
![]()
![]()
![]()
![]()
![]()
![]()
![]()
![]()
![]()
![]()
![]()
![]()
![]()
![]()
![]()
![]()
![]()
![]()
![]()
![]()
![]()
![]()
![]()
![]()
![]()
![]()
![]()
![]()
![]()
![]()
![]()
![]()
![]()
![]()
![]()
![]()
![]()
![]()
![]()
![]()
![]()
![]()
![]()
![]()
![]()
![]()
![]()
![]()
![]()
![]()
![]()
![]()
![]()
![]()
![]()
![]()
![]()
![]()
![]()
![]()
![]()
![]()
![]()
![]()
![]()
![]()
![]()
![]()
![]()
![]()
![]()
![]()
![]()
![]()
![]()
![]()
![]()
![]()
![]()
![]()
![]()
![]()
![]()
![]()
![]()
![]()
![]()
![]()
![]()
![]()
![]()
![]()
![]()
![]()
![]()
![]()
![]()
![]()
![]()
![]()
![]()
![]()
![]()
![]()
![]()
![]()
![]()
![]()
![]()
![]()
![]()
![]()
![]()
![]()
![]()
![]()
![]()
![]()
![]()
![]()
![]()
![]()
![]()
![]()
![]()
![]()
![]()
![]()
![]()
![]()
![]()
![]()
![]()
![]()
![]()
![]()
![]()
![]()
![]()
![]()
![]()
![]()
![]()
![]()
![]()
![]()
![]()
![]()
![]()
![]()
![]()
![]()
![]()
![]()
![]()
![]()
![]()
![]()
![]()
![]()
![]()
![]()
![]()
![]()
![]()
![]()
![]()
![]()
![]()
![]()
![]()
![]()
![]()
![]()
![]()
![]()
![]()
![]()
![]()
![]()
![]()
![]()
![]()
![]()
![]()
![]()
![]()
![]()
![]()
![]()
![]()
![]()
![]()
![]()
![]()
![]()
![]()
![]()
![]()
![]()
![]()
![]()
![]()
![]()
![]()
![]()
![]()
![]()
![]()
![]()
![]()
![]()
![]()
![]()
![]()
![]()
![]()
![]()
![]()
![]()
![]()
![]()
![]()
![]()
![]()
![]()
![]()
![]()
![]()
![]()
![]()
![]()
![]()
![]()
![]()
![]()
![]()
![]()
![]()
![]()
![]()
![]()
![]()
![]()
![]()
![]()
![]()
![]()
![]()
![]()
![]()
![]()
![]()
![]()
![]()
![]()
![]()
![]()
![]()
![]()
![]()
![]()
![]()
![]()
![]()
![]()
![]()
![]()
![]()
![]()
![]()
![]()
![]()
![]()
![]()
![]()
![]()
![]()
![]()
![]()
![]()
![]()
![]()
![]()
![]()
![]()
![]()
![]()
![]()
![]()
![]()
![]()
![]()
![]()
![]()
![]()
![]()
![]()
![]()
![]()
![]()
![]()
![]()
![]()
![]()
![]()
![]()
![]()
![]()
![]()
![]()
![]()
![]()
![]()
![]()
![]()
![]()
![]()
![]()
![]()
![]()
![]()
![]()
![]()
![]()
![]() 20%
20%
![]()
![]()
![]()
![]()
![]()
![]()
![]()
![]()
![]()
![]()
![]()
![]()
![]()
![]()
![]()
![]()
![]()
![]()
![]()
![]()
![]()
![]()
![]()
![]()
![]()
![]()
![]()
![]()
![]()
![]()
![]()
![]()
![]()
![]()
![]()
![]()
![]()
![]()
![]()
![]()
![]()
![]()
![]()
![]()
![]()
![]()
![]()
![]()
![]()
![]()
![]()
![]()
![]()
![]()
![]()
![]()
![]()
![]()
![]()
![]()
![]()
![]()
![]()
![]()
![]()
![]()
![]()
![]()
![]()
![]()
![]()
![]()
![]()
![]()
![]()
![]()
![]()
![]()
![]()
![]()
![]()
![]()
![]()
![]()
![]()
![]()
![]()
![]()
![]()
![]()
![]()
![]()
![]()
![]()
![]()
![]()
![]()
![]()
![]()
![]()
![]()
![]()
![]()
![]()
![]()
![]()
![]()
![]()
![]()
![]()
![]()
![]()
![]()
![]()
![]()
![]()
![]()
![]()
![]()
![]()
![]()
![]()
![]()
![]()
![]()
![]()
![]()
![]()
![]()
![]()
![]()
![]()
![]()
![]()
![]()
![]()
![]()
![]()
![]()
![]()
![]()
![]()
![]()
![]()
![]()
![]()
![]()
![]()
![]()
![]()
![]()
![]()
![]()
![]()
![]()
![]()
![]()
![]()
![]()
![]()
![]()
![]()
![]()
![]()
![]()
![]()
![]()
![]()
![]()
![]()
![]()
![]()
![]()
![]()
![]()
![]()
![]()
![]()
![]()
![]()
![]()
![]()
![]()
![]()
![]()
![]()
![]()
![]()
![]()
![]()
![]()
![]()
![]()
![]()
![]()
![]()
![]()
![]()
![]()
![]()
![]()
![]()
![]()
![]()
![]()
![]()
![]()
![]()
![]()
![]()
![]()
![]()
![]()
![]()
![]()
![]()
![]()
![]()
![]()
![]()
![]()
![]()
![]()
![]()
![]()
![]()
![]()
![]()
![]()
![]()
![]()
![]()
![]()
![]()
![]()
![]()
![]()
![]()
![]()
![]()
![]()
![]()
![]()
![]()
![]()
![]()
![]()
![]()
![]()
![]()
![]()
![]()
![]()
![]()
![]()
![]()
![]()
![]()
![]()
![]()
![]()
![]()
![]()
![]()
![]()
![]()
![]()
![]()
![]()
![]()
![]()
![]()
![]()
![]()
![]()
![]()
![]()
![]()
![]()
![]()
![]()
![]()
![]()
![]()
![]()
![]()
![]()
![]()
![]()
![]()
![]()
![]()
![]()
![]()
![]()
![]()
![]()
![]()
![]()
![]()
![]()
![]() Cladopho
Cladopho ![]()
![]()
![]()
![]()
![]()
![]()
![]()
![]()
![]()
![]()
![]()
![]()
![]()
![]()
![]()
![]()
![]()
![]()
![]()
![]()
![]()
![]()
![]()
![]()
![]()
![]()
![]()
![]()
![]()
![]()
![]()
![]()
![]()
![]()
![]()
![]()
![]()
![]()
![]()
![]()
![]()
![]()
![]()
![]()
![]()
![]()
![]()
![]()
![]()
![]()
![]()
![]()
![]()
![]()
![]()
![]()
![]()
![]()
![]()
![]()
![]()
![]()
![]()
![]()
![]()
![]()
![]()
![]()
![]()
![]()
![]()
![]()
![]()
![]()
![]()
![]()
![]()
![]()
![]()
![]()
![]()
![]()
![]()
![]()
![]()
![]()
![]()
![]()
![]()
![]()
![]()
![]()
![]()
![]()
![]()
![]()
![]()
![]()
![]()
![]()
![]()
![]()
![]()
![]()
![]()
![]()
![]()
![]()
![]()
![]()
![]()
![]()
![]()
![]()
![]()
![]()
![]()
![]()
![]()
![]()
![]()
![]()
![]()
![]()
![]()
![]()
![]()
![]()
![]()
![]()
![]()
![]()
![]()
![]()
![]()
![]()
![]()
![]()
![]()
![]()
![]()
![]()
![]()
![]()
![]()
![]()
![]()
![]()
![]()
![]()
![]()
![]()
![]()
![]()
![]()
![]()
![]()
![]()
![]()
![]()
![]()
![]()
![]()
![]()
![]()
![]()
![]()
![]()
![]()
![]()
![]()
![]()
![]()
![]()
![]()
![]()
![]()
![]()
![]()
![]()
![]()
![]()
![]()
![]()
![]()
![]()
![]()
![]()
![]()
![]()
![]()
![]()
![]()
![]()
![]()
![]()
![]()
![]()
![]()
![]()
![]()
![]()
![]()
![]()
![]()
![]()
![]()
![]()
![]()
![]()
![]()
![]()
![]()
![]()
![]()
![]()
![]()
![]()
![]()
![]()
![]()
![]()
![]()
![]()
![]()
![]()
![]()
![]()
![]()
![]()
![]()
![]()
![]()
![]()
![]()
![]()
![]()
![]()
![]()
![]()
![]()
![]()
![]()
![]()
![]()
![]()
![]()
![]()
![]()
![]()
![]()
![]()
![]()
![]()
![]()
![]()
![]()
![]()
![]()
![]()
![]()
![]()
![]()
![]()
![]()
![]()
![]()
![]()
![]()
![]()
![]()
![]()
![]()
![]()
![]()
![]()
![]()
![]()
![]()
![]()
![]()
![]()
![]()
![]()
![]()
![]()
![]()
![]()
![]()
![]()
![]()
![]()
![]()
![]()
![]()
![]()
![]()
![]()
![]()
![]()
![]()
![]()
![]()
![]()
![]()
![]()
![]()
![]()
![]()
![]()
![]()
![]()
![]()
![]()
![]()
![]()
![]()
![]()
![]()
![]()
![]()
![]()
![]()
![]()
![]()
![]()
![]()
![]()
![]()
![]()
![]()
![]()
![]()
![]()
![]()
![]()
![]()
![]()
![]()
![]()
![]()
![]()
![]()
![]()
![]()
![]()
![]()
![]()
![]()
![]()
![]()
![]()
![]()
![]()
![]()
![]()
![]()
![]()
![]()
![]()
![]()
![]()
![]()
![]()
![]()
![]()
![]()
![]()
![]()
![]()
![]()
![]()
![]()
![]()
![]()
![]()
![]()
![]()
![]()
![]()
![]()
![]()
![]()
![]()
![]()
![]()
![]()
![]()
![]()
![]()
![]()
![]()
![]()
![]()
![]()
![]()
![]()
![]()
![]()
![]()
![]()
![]()
![]()
![]()
![]()
![]()
![]()
![]()
![]()
![]()
![]()
![]()
![]()
![]()
![]()
![]()
![]()
![]()
![]()
![]()
![]()
![]()
![]()
![]()
![]()
![]()
![]()
![]()
![]()
![]()
![]()
![]()
![]()
![]()
![]()
![]()
![]()
![]() ra Cladoph
ra Cladoph
![]()
![]()
![]()
![]()
![]()
![]()
![]()
![]()
![]()
![]()
![]()
![]()
![]()
![]()
![]()
![]()
![]()
![]()
![]()
![]()
![]()
![]()
![]()
![]()
![]()
![]()
![]()
![]()
![]()
![]()
![]()
![]()
![]()
![]()
![]()
![]()
![]()
![]()
![]()
![]()
![]()
![]()
![]()
![]()
![]()
![]()
![]()
![]()
![]()
![]()
![]()
![]()
![]()
![]()
![]()
![]()
![]()
![]()
![]()
![]()
![]()
![]()
![]()
![]()
![]()
![]()
![]()
![]()
![]()
![]()
![]()
![]()
![]()
![]()
![]()
![]()
![]()
![]()
![]()
![]()
![]()
![]()
![]()
![]()
![]()
![]()
![]()
![]()
![]()
![]()
![]()
![]()
![]()
![]()
![]()
![]()
![]()
![]()
![]()
![]()
![]()
![]()
![]()
![]()
![]()
![]()
![]()
![]()
![]()
![]()
![]()
![]()
![]()
![]()
![]()
![]()
![]()
![]()
![]()
![]()
![]()
![]()
![]()
![]()
![]()
![]()
![]()
![]()
![]()
![]()
![]()
![]()
![]()
![]()
![]()
![]()
![]()
![]()
![]()
![]()
![]()
![]()
![]()
![]()
![]()
![]()
![]()
![]()
![]()
![]()
![]()
![]()
![]()
![]()
![]()
![]()
![]()
![]()
![]()
![]()
![]()
![]()
![]()
![]()
![]()
![]()
![]()
![]()
![]()
![]()
![]()
![]()
![]()
![]()
![]()
![]() rupestris
rupestris
![]()
![]()
![]()
![]()
![]()
![]()
![]()
![]()
![]()
![]()
![]()
![]()
![]()
![]()
![]()
![]()
![]()
![]()
![]()
![]()
![]()
![]()
![]()
![]()
![]()
![]()
![]()
![]()
![]()
![]()
![]()
![]()
![]()
![]()
![]()
![]()
![]()
![]()
![]()
![]()
![]()
![]()
![]()
![]()
![]()
![]()
![]()
![]()
![]()
![]()
![]()
![]()
![]()
![]()
![]()
![]()
![]()
![]()
![]()
![]()
![]()
![]()
![]()
![]()
![]()
![]()
![]()
![]()
![]()
![]()
![]()
![]()
![]()
![]()
![]()
![]()
![]()
![]()
![]()
![]()
![]()
![]()
![]()
![]()
![]()
![]()
![]()
![]()
![]()
![]()
![]()
![]()
![]()
![]()
![]()
![]()
![]()
![]()
![]()
![]()
![]()
![]()
![]()
![]()
![]()
![]()
![]()
![]()
![]()
![]()
![]()
![]()
![]()
![]()
![]()
![]()
![]()
![]()
![]()
![]()
![]()
![]()
![]()
![]()
![]()
![]()
![]()
![]()
![]()
![]()
![]()
![]()
![]()
![]()
![]()
![]()
![]()
![]()
![]()
![]()
![]()
![]()
![]()
![]()
![]()
![]()
![]()
![]()
![]()
![]()
![]()
![]()
![]()
![]()
![]()
![]()
![]()
![]()
![]()
![]()
![]()
![]()
![]()
![]()
![]()
![]()
![]()
![]()
![]()
![]()
![]()
![]()
![]()
![]()
![]()
![]()
![]()
![]()
![]()
![]()
![]()
![]()
![]()
![]()
![]()
![]()
![]()
![]()
![]()
![]()
![]()
![]()
![]()
![]()
![]()
![]()
![]()
![]()
![]()
![]()
![]()
![]()
![]()
![]()
![]()
![]()
![]()
![]()
![]()
![]()
![]()
![]()
![]()
![]()
![]()
![]()
![]()
![]()
![]()
![]()
![]()
![]()
![]()
![]()
![]()
![]()
![]()
![]()
![]()
![]()
![]()
![]()
![]()
![]()
![]()
![]()
![]()
![]()
![]()
![]()
![]()
![]()
![]()
![]()
![]()
![]()
![]()
![]()
![]()
![]()
![]()
![]()
![]()
![]()
![]()
![]()
![]()
![]()
![]()
![]()
![]()
![]()
![]()
![]()
![]()
![]()
![]()
![]()
![]()
![]()
![]()
![]()
![]()
![]()
![]()
![]()
![]()
![]()
![]()
![]()
![]()
![]()
![]()
![]()
![]()
![]()
![]()
![]()
![]()
![]()
![]()
![]()
![]()
![]()
![]()
![]()
![]()
![]()
![]()
![]()
![]()
![]()
![]()
![]()
![]()
![]()
![]()
![]()
![]()
![]()
![]()
![]()
![]()
![]()
![]()
![]()
![]()
![]()
![]()
![]()
![]()
![]()
![]()
![]()
![]()
![]()
![]()
![]()
![]()
![]()
![]()
![]()
![]()
![]()
![]()
![]()
![]()
![]()
![]()
![]()
![]()
![]()
![]()
![]()
![]()
![]()
![]()
![]()
![]()
![]()
![]()
![]()
![]()
![]()
![]()
![]()
![]()
![]()
![]()
![]()
![]()
![]()
![]()
![]()
![]()
![]()
![]()
![]()
![]()
![]()
![]()
![]()
![]()
![]()
![]()
![]()
![]()
![]()
![]()
![]()
![]()
![]()
![]()
![]()
![]()
![]()
![]()
![]()
![]()
![]()
![]()
![]()
![]()
![]()
![]()
![]()
![]()
![]()
![]()
![]()
![]()
![]()
![]()
![]()
![]()
![]()
![]()
![]()
![]()
![]()
![]()
![]()
![]()
![]()
![]()
![]()
![]()
![]()
![]()
![]()
![]()
![]()
![]()
![]()
![]()
![]()
![]()
![]()
![]()
![]()
![]()
![]()
![]()
![]()
![]()
![]()
![]()
![]()
![]()
![]()
![]()
![]()
![]()
![]()
![]()
![]()
![]()
![]()
![]()
![]()
![]()
![]()
![]()
![]()
![]()
![]()
![]()
![]()
![]()
![]()
![]()
![]()
![]()
![]()
![]()
![]()
![]()
![]()
![]()
![]()
![]()
![]()
![]()
![]()
![]()
![]()
![]()
![]()
![]()
![]()
![]()
![]()
![]()
![]()
![]()
![]()
![]()
![]()
![]()
![]()
![]()
![]()
![]()
![]()
![]()
![]()
![]()
![]()
![]()
![]()
![]()
![]()
![]()
![]()
![]()
![]()
![]()
![]()
![]()
![]()
![]()
![]()
![]()
![]()
![]()
![]()
![]()
![]()
![]()
![]()
![]()
![]()
![]()
![]()
![]()
![]()
![]()
![]()
![]()
![]()
![]()
![]()
![]()
![]()
![]()
![]()
![]()
![]()
![]()
![]()
![]()
![]()
![]()
![]()
![]()
![]()
![]()
![]()
![]()
![]()
![]()
![]()
![]()
![]()
![]()
![]()
![]()
![]()
![]()
![]()
![]()
![]()
![]()
![]()
![]()
![]()
![]()
![]()
![]()
![]()
![]()
![]()
![]()
![]()
![]()
![]()
![]()
![]()
![]()
![]()
![]()
![]()
![]()
![]()
![]()
![]()
![]()
![]()
![]()
![]()
![]()
![]()
![]()
![]()
![]()
![]()
![]()
![]()
![]()
![]()
![]()
![]()
![]()
![]()
![]()
![]()
![]()
![]()
![]()
![]()
![]()
![]()
![]()
![]()
![]()
![]()
![]()
![]()
![]()
![]()
![]()
![]()
![]()
![]()
![]()
![]()
![]()
![]()
![]()
![]()
![]()
![]()
![]()
![]()
![]()
![]()
![]()
![]()
![]()
![]()
![]()
![]()
![]()
![]()
![]()
![]()
![]()
![]()
![]()
![]()
![]()
![]()
![]()
![]()
![]()
![]()
![]()
![]()
![]()
![]()
![]()
![]()
![]()
![]()
![]()
![]()
![]()
![]()
![]()
![]()
![]()
![]()
![]()
![]()
![]()
![]()
![]()
![]()
![]()
![]()
![]()
![]()
![]()
![]()
![]()
![]()
![]()
![]()
![]()
![]()
![]()
![]()
![]()
![]()
![]()
![]()
![]()
![]()
![]()
![]()
![]()
![]()
![]()
![]()
![]()
![]()
![]()
![]()
![]()
![]()
![]()
![]()
![]()
![]()
![]()
![]()
![]()
![]()
![]()
![]()
![]()
![]()
![]()
![]()
![]()
![]()
![]()
![]()
![]()
![]()
![]()
![]()
![]()
![]()
![]()
![]()
![]()
![]()
![]()
![]()
![]()
![]()
![]()
![]()
![]()
![]()
![]()
![]()
![]()
![]()
![]()
![]()
![]()
![]()
![]()
![]()
![]()
![]()
![]()
![]()
![]()
![]()
![]()
![]()
![]()
![]()
![]()
![]()
![]()
![]()
![]()
![]()
![]()
![]()
![]()
![]()
![]()
![]()
![]()
![]()
![]()
![]()
![]()
![]()
![]()
![]()
![]()
![]()
![]()
![]()
![]()
![]()
![]()
![]()
![]()
![]()
![]()
![]()
![]()
![]()
![]()
![]()
![]()
![]()
![]()
![]()
![]()
![]()
![]()
![]()
![]()
![]()
![]()
![]()
![]()
![]()
![]()
![]()
![]()
![]()
![]()
![]()
![]()
![]()
![]()
![]()
![]()
![]()
![]()
![]()
![]()
![]()
![]()
![]()
![]()
![]()
![]()
![]()
![]()
![]()
![]()
![]()
![]()
![]()
![]()
![]()
![]()
![]()
![]()
![]()
![]()
![]()
![]()
![]()
![]()
![]()
![]()
![]()
![]()
![]()
![]()
![]()
![]()
![]()
![]()
![]()
![]()
![]()
![]()
![]()
![]()
![]()
![]()
![]()
![]()
![]()
![]()
![]()
![]()
![]()
![]()
![]()
![]()
![]()
![]()
![]()
![]()
![]()
![]()
![]()
![]()
![]()
![]()
![]()
![]()
![]()
![]()
![]()
![]()
![]()
![]()
![]()
![]()
![]()
![]()
![]()
![]()
![]()
![]()
![]()
![]()
![]()
![]()
![]()
![]()
![]()
![]()
![]()
![]()
![]()
![]()
![]()
![]()
![]()
![]()
![]()
![]()
![]()
![]()
![]()
![]()
![]()
![]()
![]()
![]()
![]()
![]()
![]()
![]()
![]()
![]()
![]()
![]()
![]()
![]()
![]()
![]()
![]()
![]()
![]()
![]()
![]()
![]()
![]()
![]()
![]()
![]()
![]()
![]()
![]()
![]()
![]()
![]()
![]()
![]()
![]()
![]()
![]()
![]()
![]()
![]()
![]()
![]()
![]()
![]()
![]() 80% rupoersat ris
80% rupoersat ris ![]()
![]()
![]() 70%
70% ![]()
Figure 12: Macro-algal populations of settling plates in St. Aubin's Bay at a) Elizabeth Castle, b) St. Aubin's Fort and St. Ouën's Bay at c) La Pulante, d) L'Etacq.
- DISCUSSION
Due to the time and resource constraints, this study was of a preliminary nature. Concentrations were not taken over a continuous period and only small sections of the inter-tidal habitat could be measured. However despite these restrictions, the data collected have proved useful in obtaining details of the nutrient loading into inter-tidal regions, and the response of macro-algal populations to this loading.
Other studies have indicated differences in the loadings for St. Aubin's and St. Ouën's Bay (Foster et al., 1989; Stapleton et al., 2000) and this is supported by the findings of this study. The total average monthly loading (Lt) of DAIN and DAIP was found to be a magnitude higher for St. Aubin's Bay (25,647kg and 2,246kg respectively) than for St. Ouën's Bay (2,240kg and 171kg respectively). The WwTW accounts for 62% of the DAIN load and 93% of the DAIP load into St. Aubin's Bay and has the highest contribution of nutrients compared to individual catchment sources. However these figures may be an under-estimate of the actual total nutrient loading into St. Aubin's Bay.
Loadings from the Grands Vaux and Bellozanne Valley catchments – both out-falling into St. Aubin's Bay – were not measured in this study. These are comparably large catchments, with agricultural and urban areas. Leaching of nutrients from these catchments into respective watercourses is quite probable, and therefore it is expected the nutrient loadings for these catchments would be similar to the other catchments out- falling into St. Aubin's. Therefore the percentage contribution of nutrient load from the WwTW may be an overestimate.
The positions of the Bays on the island differ, as explained in Section 2.1. Both bay's experience semi-diurnal tides with similar tidal ranges; however, St. Ouën's Bay experiences more energy from the Atlantic as a result of its position to the west of the island and its open coastline. These differences are important to consider when looking at the impact of nutrient loads on the macro-algal populations of these bays. It is likely St. Aubin's Bay has a longer residence time because of its sheltered nature. The macro- algal populations therefore experience both higher nutrient levels in-situ (as demonstrated above) and for a longer period, thus allowing opportunistic algae to dominate the habitat.
There were noticeable differences in the macro-algal populations of the different bays.
The data from the settling plates indicate that pioneer species for both bays are classed
as ESG2 taxa, which tend to be faster growing. St. Aubin's plates tended to have more diverse growth and had opportunistic taxa, whereas no opportunistic taxa were identified for both plates in St. Ouën's. There was, however, greater coverage of the two plates in St. Ouën's (85% and 90%) than for St. Aubin's (63% and 22%), implying faster growth rates. This is unexpected, as faster growth rates tend to occur under higher nutrient levels, and therefore more growth would be expected on the St. Aubin's plates. It is likely that there are other factors that have not been considered here, which could explain these results. These could include differences in the grazing rates by benthic invertebrates or differences in the irradiance and salinity levels of the chosen rock pools. It is possible that excessive nutrient levels would have an adverse effect on the growth rates of these species, although this is considered unlikely.
Using the methodology in WFD UKTAG, (2009a), St. Aubin's Bay had BAD to POOR status conditions for the macro-algal populations, using the ecological quality ratio (EQR). It also had comparably low numbers of macroalgal taxa, a higher proportion of opportunistic taxa, a higher proportion of ESG2 to ESG1 taxa, and higher species richness to those in St. Ouën's Bay.
The reduction in species richness, especially endemic species (perennials) such as Chondrus crispus (ESG1), Coralina officinalis (ESG1), Halidrys siliquosa (ESG1) and Gracilaria gracilis (ESG1) found in St. Ouën's Bay, suggests St. Aubin's Bay is a more homogenous environment and has a decreased diversity of the macro-algal populations. Considering the higher nutrient loading into St. Aubin's Bay, it appears there have been changes in the dominant species, towards opportunistic, ESG2 taxa (Ulva lactuca, Enteromorpha sp.), with the exception of Fucus spiralis (ESG1) and a general shift in the macro-algal population.
St. Ouën's Bay still experiences nutrient loading from catchment sources, but at lower levels compared to St. Aubins' Bay. St. Ouën's Bay may also have a shorter residence time, caused by flushing of the system from Atlantic waves. Macro-algal populations therefore tend to receive lower levels of nutrients for shorter time periods, which may explain the MODERATE status condition (EQR), why there are lower levels of opportunistic and ESG2 algae, and a more diverse population.
Nitrate (NO3) and nitrite (NO2) concentrations did not differ seasonally in catchment watercourses. Only concentrations of NH3 (P<0.05) and PO4 (DAIP) (P<0.01) varied between spring and summer, and only NH3 (P<0.05) varied between all three seasons measured. There was little variation in the nutrient concentrations from the watercourses out-falling into St. Aubin's and St. Ouën's Bay, and no significant differences between catchments were found. This is in contrast to the findings of Foster et al. (1989), who found a seasonal relationship between the concentrations of nutrients in watercourses and farming practices in catchment areas, especially those out-falling into St. Ouen 's Bay. They concluded this was a result of the use of plastic sheets in these areas – used to protect crops from frost and facilitate an early harvest. The plastic sheeting inhibits infiltration, resulting in lower nutrient levels in watercourses draining the catchment. Nutrient concentrations after the plastic sheeting was removed in late summer were found to be greatly increased, and subsequently caused an increase in leaching of available nutrients from the catchment.
The discrepancy between the findings of this study and those of Foster et al. (1989) may be due to the limitations in the data collection for this study (where fluctuations in between the months of March and September will not have been included) rather than changes in farming practices since that study was conducted (Deahl et al., 2009). As of 2007, potato crops still represent around 35% of the agricultural land or approximately 20% of the total land area. Approximately 50% of the early crops is protected by plastic sheeting. In 2007, 32,000 tonnes were exported with a value of £23 million (78% of the value of all exported crops).
- CONCLUSIONS
The conclusions will refer back to the four research questions stated in Section 1:
- Are there differences in the loadings of dissolved available inorganic nitrogen (DAIN) and dissolved available inorganic phosphorus (DAIP) from catchment sources (watercourses) into St. Ouën's Bay and St. Aubin's Bay?
The total average monthly loading (Lt) of DAIN and DAIP was found to be a magnitude higher for St. Aubin's Bay than for St. Ouën's Bay, although the figures for St. Aubin's Bay may be an under-estimate.
- Does the discharge from the Wastewater Treatment Works (WwTW) out-falling into St. Aubin's Bay considerably affect the total nutrient input into coastal waters?
The WwTW accounts for 62% of the DAIN load and 93% of the DAIP load into St. Aubin's Bay and has the highest contribution of nutrients compared to individual catchment sources. The results suggest that its contribution is the reason the total average monthly nutrient loading for St. Aubin's was a magnitude higher than St. Ouën's.
- What are the current conditions of the macro-algal populations of St. Ouën's Bay and St. Aubin's Bay?
The ecological quality ratio rates the macro-algal populations in St. Aubin's Bay as BAD-POOR. St. Aubin's also had a lower ecological status group ratio (ESG), indicating a shift from a pristine state to a degraded state. There were changes in dominance and pioneer species as compared with the macro-algal population of St. Ouën's Bay, which had an ecological quality ratio of MODERATE and a more diverse population.
- Can any observed changes in the biodiversity of benthic marine macro-algae found in either baybe attributed to the nutrient loadings from either catchment or wastewater sources?
Macro-algal populations of St. Aubin's Bay received higher levels of nutrients due to the nutrient loading from the WwTW, which may explain the BAD-POOR status condition and why there are higher levels of opportunistic algae, and general reduction in the diversity of the population.
The findings of this study provide a preliminary analysis that suggest that the current nutrient loadings from the Jersey WwTW are currently adversely affecting the marine environment. Because of the physical characteristics of St. Aubin's, which cause longer residence times of nutrients, it is important that nutrient input is well managed to protect the ecology of the bay. Major sources of nutrients such as the WwTW must be carefully monitored and minimised where possible. The study therefore concludes that the current proposals to rectify the excessive nutrient input from the works are well justified.
Investigations on Ulva blooms in the bay of Saint-Brieuc on the French coast indicate that nitrogen rather than phosphorus controls the maximal biomass of green seaweeds (Piriou & Ménesguen, 1992). For sites with favourable hydrodynamic conditions and where Ulva production is problematical – such as St. Aubin's Bay – only a reduction of nitrogen loadings from rivers is needed to return the biomass to an acceptable situation (ibid). Indeed, Ménesguen et al. (2006) found that the nitrogen turnover in Ulva sp. is only 4 months. Thus, improvements in the macro-algal population would occur within a year following large nitrogen reductions, therefore if the improvements to the WwTW are combined with more sustainable farming practices the populations of macro-algae in St. Aubin's Bay may become more similar to those found in St. Ouën's Bay.
- RECOMMENDATIONS FOR FURTHER WORK
There are some issues with the methodology adapted from WFD UKTAG, (2009a) used in this study, as highlighted in its preliminary form by Wells et al. (2007). The EC Water Framework Directive (WFD) suggests using abundance and species composition of intertidal seaweed communities for ecological quality classification of rocky seashores. Well et al. (2007) find difficulties with this method. According to the WFD, all sensitive species should be present on a shore but there is no accepted list of sensitive seaweed species and those which may be sensitive in one location may not be so in another, particularly when comparing study systems such as St. Aubin's and St. Ouën's Bay. Also, natural successions can result in very large abundance changes of common species.
A database of species, under strictly controlled sampling conditions, has given ranges of values of species richness to be expected and has allowed for variations in these values due to sub-habitat variability, wave exposure and turbidity to be factored in (ibid), as was used in this study. However, a major problem in applying this tool is the lack of expertise in critical identification of seaweed species, as was found to some extent whilst conducting this study.
For this methodology to produce more reliable results, effective sampling needs to be carried under close control to ensure a uniform level of thoroughness. This would include multiple belt transects across the inter-tidal habitat, over a longer time scale.
This study has a limited scope, and makes simple correlations between ambient levels of nutrients and the measure of algal production and diversity. It assumes the nutrient in highest concentration is the predominant form that supports macrophytic growth. However, the relative utilization of ammonia and nitrate as part of DAIN, by macroalgae is not in direct proportion to the external concentration of the surrounding water (Littler & Littler, 1985). Indeed, identifying which nutrient acts as the main limiting factor of primary production in a particular coastal system is difficult (Smith, 1994; Taylor et al., 1995; Howarth & Marino, 2006). Therefore further studies should estimate the dynamics of nutrient use by the macro-algal populations. This would use a combination of techniques such as long-term nutrient monitoring and short-term uptake experiments, to determine the dynamic relation between nutrient supply and algal production.
![]() In order to develop a better understanding of how nutrients are used in these bays, a greater knowledge of the nutrient recycling of the bays is needed, as several additional factors should be taken into account. The hydro-dynamical circulation and local climatic conditions could vary significantly between the two bays. In addition, phosphorus has a more rapid mineralisation rate as compared to nitrogen recycling. Nitrogen fixation or denitrification rates and the storage and recycling of nutrients at the benthic phase may also vary between the two bays (DeMaster et al., 1996; Garnier & Billen, 2002; Cantoni et al., 2003; Cugier et al., 2005; Lancelot et al., 2005, 2007).
In order to develop a better understanding of how nutrients are used in these bays, a greater knowledge of the nutrient recycling of the bays is needed, as several additional factors should be taken into account. The hydro-dynamical circulation and local climatic conditions could vary significantly between the two bays. In addition, phosphorus has a more rapid mineralisation rate as compared to nitrogen recycling. Nitrogen fixation or denitrification rates and the storage and recycling of nutrients at the benthic phase may also vary between the two bays (DeMaster et al., 1996; Garnier & Billen, 2002; Cantoni et al., 2003; Cugier et al., 2005; Lancelot et al., 2005, 2007).
ACKNOWLEDGEMENTS
![]() This research was funded by the University of East Anglia under the supervision of Dr. Alex Baker. My thanks go to Alan Holmes, Robert McSweeney and Vicky Gavey for their assistance and support whilst conducting field analysis. Further thanks to the UEA laboratory technicians Emma Hooper and Kimberley Wright for their support throughout this study. I would also like to thank the States of Jersey for their permission to undertake field analysis and the use of their GIS software and data.
This research was funded by the University of East Anglia under the supervision of Dr. Alex Baker. My thanks go to Alan Holmes, Robert McSweeney and Vicky Gavey for their assistance and support whilst conducting field analysis. Further thanks to the UEA laboratory technicians Emma Hooper and Kimberley Wright for their support throughout this study. I would also like to thank the States of Jersey for their permission to undertake field analysis and the use of their GIS software and data.
BIBLIOGRAPHY
Bishop, A. C. and Bisson, G. (1989) Classical areas of British geology: Jersey: description of 1:25,000 Channel Islands Sheet 2. (London: HMSO for British Geological Survey.)
Bricker, S.B., Ferreira, J.G., Simas, T., (2003) An integrated methodology for assessment of estuarine trophic status, Ecol. Modell., 169, 39–60.
Cantoni, C., Cozzi, S., Pecchiar, I., Cabrini, M., Mozetic, P., Catalano, G., Fonda Umani, S., (2003) Short-term variability of primary production and inorganic nitrogen uptake related to the environmental conditions in a shallow coastal area (Gulf of Trieste, N. Adriatic Sea), Oceanologica Acta 26, 565–575.
Cloern, J.E., (2001) Our evolving conceptual model of the coastal eutrophication problem, Mar. Ecol. Prog. Ser. 210, 223–253.
Cooper, N.J. and Pethick, J.S. (2005) Sediment budget approach to addressing coastal erosion problems in St. Ouën's Bay, Jersey, Channel Islands, Journal of Coastal Research, 21(1), 112-122
Cugier, P., Billen, G., Guillaud, J.F., Garnier, J., Ménesguen, A., (2005) Modelling eutrophication of the Seine Bight under present, historical and future Seine river nutrient loads, Journal of Hydrology 304, 381–396.
Deahl, K.L., Perez, F.M., Thompson, J.M., Fleming-Archibald, C., Thompson, S., Collier, R., Kildea, S. and Cooke, L.R. (2009) Characterization of Phytophthora infestans Isolates from Jersey, Channel Islands, Potato Research (online) DOI: 10.1007/s11540-009-9138-1
DeMaster, D.J., Smith Jr., W.O., Nelsons, D.M., Aller, J.Y., (1996) Biogeochemical processes in Amazon shelf waters: chemical distributions and uptake rates of silicon, carbon and nitrogen, Continental Shelf Research 16, 617–643.
Duarte, C.M., (1995) Submerged aquatic vegetation in relation to different nutrient regimes, Ophelia 41, 87–112.
Fletcher, R.T., (1996) The occurrence of green-tide', In: Schramm, W., Nienhuis, P.H. (Eds.), Marine Benthic Vegetation – Recent Changes and the Effects of Eutrophication, Ecological Studies, 123, Springer Verlag, Berlin, pp. 7–43.
Foster, I. D. L., Ilbery, B. W. and Hinton, M. A. (1989) Agriculture and water quality: a preliminary examination of the Jersey nitrate problem, Applied Geography, 9, 95- 113
Garnier, J., Billen, G., (2002) The Riverstrahler modelling approach applied to a tropical case study (The Red-Hong-River, Vietnam): nutrient transfer and impact on the Coastal Zone. SCOPE. Coll. Mar. Res. Works, 12, pp. 51–65.
GESAMP, (1990) IMO/FAO/UNESCO/WMO/WHO/IAEA/UN/UNEP Joint Group of Experts on Scientific Aspects of Marine Pollution, The state of the marine environment, Blackwell Scientific Publications, Oxford
Green, A. R., Feast, N. A., Hiscock, K. M. & Dennis, P. F. (1998) Identification of the source and fate of nitrate contamination of the Jersey bedrock aquifer using stable nitrogen isotopes, In: Robins, N. S. (ed.) Groundwater Pollution, Aquifer Recharge and Vulnerability, Geological Society, London, Special Publications, 130, 23-35
Gunton, A. (1997) Upper Foreshore Evolution and Sea Wall Stability, Jersey, Channel Islands, Journal of Coastal Research, 13(3), 813-821
Helm, D. G. (1984) The tectonic evolution of Jersey, Channel Islands, Proc. Geol. Assoc, 95, 1-15.
Howarth, R.W., Marino, R., (2006) Nitrogen as the limiting nutrient for eutrophication in coastal marine ecosystems: evolving views over three decades, Limnology and Oceanography 51, 364–376.
Kitson, N.J. (2002) Elizabeth Marina, Jersey – Modelling marina entrance improvement works In: Breakwaters, coastal structures and coastlines, Thomas Telford, ISBN 0 7277 3042 8
Lancelot, C., Spitz, Y., Gypens, N., Ruddick, K., Becquevort, S., Rousseau, V., Lacroix, G., Billen, G., (2005) Modelling diatom and Phaeocystis blooms and nutrient cycles in the Southern Bight of the North Sea: the MIRO model, Marine Ecology, Progress Series 289, 63–78.
Lancelot, C., Gypens, N., Billen, G., Garnier, J., Rousseau, V., (2007) Linking marine eutrophication to land use: an integrated river–ocean mathematical tool: The Southern Bight of the North Sea over the past 50 years, Journal of Marine Systems 64, 216–228. Littler, M. M. & Littler, D. S. (1985) Ecological Field Methods: Macro-algae, Handbook of Phycological Methods, Cambridge University Press, ISBN 0 521 24915 5 (v. 4)
Ménesguen, A., and Cugier, P. and Leblond, I. (2006) A new numerical technique for tracking chemical species in a multisource, coastal ecosystem applied to nitrogen causing Ulva blooms in the Bay of Brest (France), Limnol. Oceanogr., 51(1, part 2), 591–601
Ménesguen, A. and Dion, P. (2009) Role of phosphorus in coastal eutrophication, Oceanis, 33 (1-2), 17-35
NI EA (2008) UKTAG Summary Proforma for Water Framework Directive, Macroalgae – Reduced Species List Transitional and Coastal Waters, NI Environment Agency
Nixon, S.W., (1995) Coastal marine eutrophication: a definition, social causes, and future concerns, Ophelia 41, 199–219.
Pedersen, M.F. and Borum, J. (1997) Nutrient control of estuarine macro-algae: growth strategy and the balance between nitrogen requirements and uptake. Mar. Ecol. Prog. Ser. 161, 155-163.
Piriou, J.Y., Menesguen, A. and Salomon, J.C. (1991) The green tides of algae (Ulva sp): necessary conditions, development and comparison of sites, In: Estuaries and coasts: spatial and temporal intercomparisons, ECSA symposium, University of Caen, (eds) Elliott, M. and Ducrotoy, J.P., pp. 117-122
Piriou, J. Y. and Ménesguen, A. (1992) Environmental factors controlling the Ulva sp. blooms in Brittany (France). In: G. Colombo, I. Ferrari, V.U. Ceccherelli and R. Rossi. (eds.), Marine Eutrophication and Population Dynamics, pp. 111-115. Olsen and Olsen, Fredensborg, Denmark.
Raffaelli, D.G., Raven, J.A., Poole, L.J. (1998) Ecological impact of green macroalgal blooms, Oceanography and Marine Biology Annual Review, 36, 97–125.
Richardson, K. & Jorgensen B.B. (1996) Eutrophication: definition, history and effects. In: Jorgensen BB, Richardson K (eds) Eutrophication in Coastal Marine Ecosystems. American Geophysical Union, Washington, pp 1-19.
Robins, N.S., Chilton, P.J. and Stuart, M.E. (1993) Jersey groundwater- Year 3: further observations and potential sources of pollution, British Geological Survey, Technical Report WD/93/28
Robins, N. S. and Smedley, P. L. (1994) Hydrogeology and hydrogeochemistry of a small, hard-rock island – the heavily stressed aquifer of Jersey, Journal of Hydrology, 163, 249-269
Robins, N. S. and Smedley, P. L. (1998) The Jersey groundwater study, British Geological Survey Research Report RR/98/5. 48pp
Schindler, D. W. E., Fee, J., and Ruszgynsi, T. (1978) Phosphorus input and its consequences for phytoplankton standing crop and production in the Experimental Lakes Area and in similar lakes, J. Fish, Res. Bd. Can. 35, 190-196.
Smith, S.V., (1994) Phosphorus versus nitrogen limitation in the marine environment, Limnology and Oceanography 29, 1149–1160.
States of Jersey (2009) Bellozanne sewage treatment works- consent compliance, Transport and Technical Services, Ref: MD-T-2009-0111, Public Report, Available (Online) at: http://www.gov.je/StatesGreffe/MinisterialDecision/TransportTechnical Services/2009/mdt20090111.htm?DisplayReport=true
Stapleton, C.M., Kay, D., Jackson , G.F., Wyer, M.D. (2000) Estimated inorganic nutrient inputs to the coastal waters of Jersey from catchment and waste water sources, Water Resources, 34, 3 787-796
Taylor , D., Nixon, S., Granger, B., Buckley, B., (1995) Nutrient limitation and the eutrophication of coastal lagoons, Marine Ecology, Progress Series 127, 235–244.
Valiela, I., McClelland, J., Hauxwell, J., Behr, P.J., Hersh, D., Foreman, K., (1997) Macroalgal blooms in shallow estuaries: controls and ecophysiological and ecosystem consequences, Limnology and Oceanography 42 (5), 1105–1118.
Wells, E., Wilkinson, M., Wood, P., Scanlan, C. (2007) The use of macroalgal species richness and composition on intertidal rocky seashores in the assessment of ecological quality under the European Water Framework Directive, Marine Pollution Bulletin, 55, 151–161
WFD UKTAG (2009a) UKTAG Coastal Water Assessment Methods Macro-algae: Macro-algae- Rocky shore reduced species list, Water Framework Directive- United Kingdom Technical Advisory Group (WFD-UKTAG), SNIFFER, April 2009, ISBN: 978-1- 906934-17-0
WFD UKTAG (2009b) UKTAG Tranisitional and Coastal Water Assessment Methods: Macro-algae, Macroalgal Bloom Assessment (Opportunistic Macro-algae), Water Framework Directive- United Kingdom Techincal Advisory Group (WFD-UKTAG), SNIFFER, May 2009, ISBN: 978-1-906934-15-6
Wyer, M. and Kay, D. (2009) Assessment of bathing water quality for the States of Jersey 2009, A report to environmental protection, States of Jersey, Centre for research into environment and health
APPENDICES
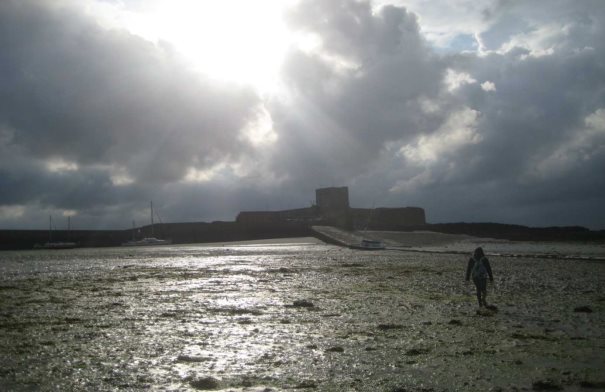
Figure 13: St. Aubin's Fort rock abrasion platform (West of St. Aubin's Bay)
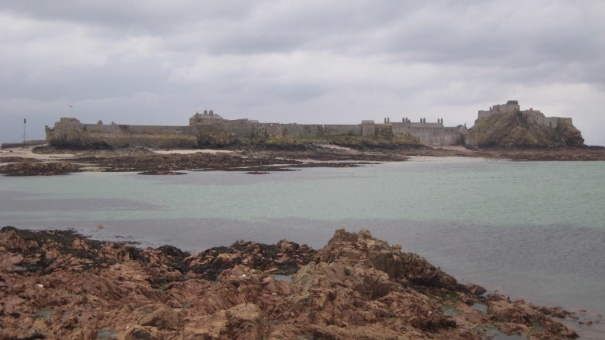
Figure 14: Elizabeth Castle rock abrasion platform (East of St. Aubin's Bay)
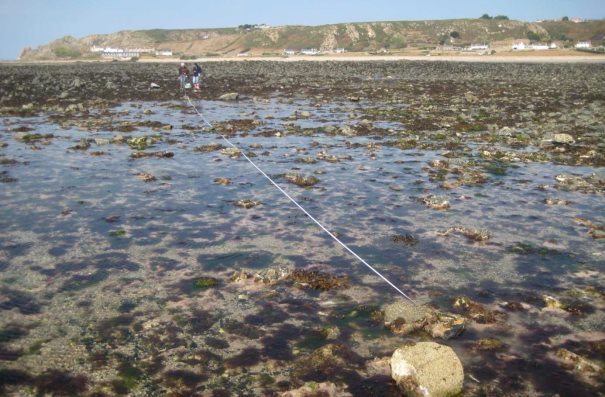
Figure 15: L'Etacq rock abrasion platform (North of St. Ouën's Bay)

Figure 16: La Pulente rock abrasion platform (South of St. Ouën's Bay)
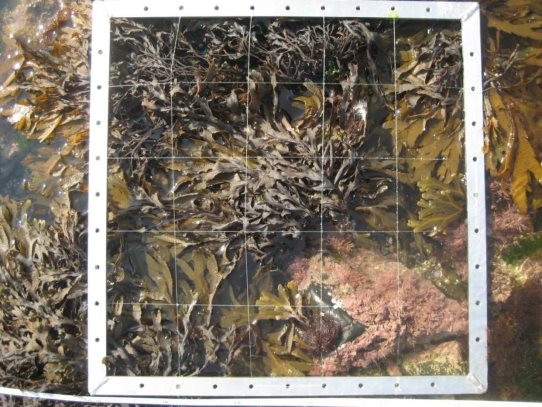
Figure 17: Photo of quadrat and macro-algal population, taken as part of the survey of L'Etacq rock abrasion platform in St. Ouën's Bay. Species are predominantly ESG1 such as Fucus sp. and Coralina officinalis.
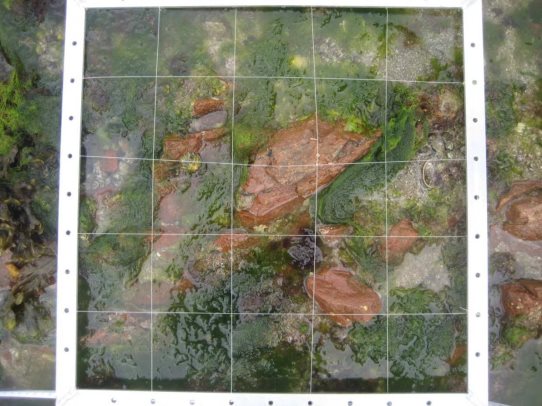
Figure 18: Photo of quadrat and macro-algal population, taken as part of the survey of Elizabeth Castle rock abrasion platform in St. Aubin's Bay. Species are predominantly ESG2 such as Ulva sp. and Enteromorpha sp.
Project Proposal
Date: 19/04/2008 Background and Rationale
This work will investigate the cause of increased levels of Ulva lactuca populations surrounding St. Aubin's Bay in Jersey. In recent years there has been an increased production of large seaweeds in shallow coastal waters. These macroalgae are mostly of the Ulva species, able to survive in fluctuating environments because of their ability to rapidly take-up and store nutrients.
A report titled the State of Jersey (2005) considered that large amounts of rapidly decaying sea lettuce and similar species were probably produced from increased nitrates and phosphates entering coastal waters. According to the report the large anoxic rotting masses do not provide habitat or a food source for species and are not important in any naturally occurring food chain. Macroalgal growth is modulated by factors such as light, nutrient availability, and temperature, although in sub-tidal environments the period of maximum growth appears to be determined by nitrogen availability (Lapointe & Tenore, 1981; Fujita et al., 1989; Sand-Jensen, 1991; Couthino & Zingmark, 1993).
Jersey streams are characterized by high nitrate concentrations; maximum recorded 1169 mg/l (Langley et. al., 1997). Over 80% of samples had nitrate concentrations above the drinking water abstraction imperative and water for human consumption maximum admissible concentration of 50 mg/l as NO3 (Langley et. al., 1997). High nutrient concentrations are related to intensive agriculture (e.g. potato cropping) which requires relatively high fertilizer applications. In the short term, Jersey stream waters abstracted for supply will require de-nitrification, to achieve reductions in nitrate levels in line with current EC Directive criteria (The States of Jersey are currently under no legal obligation to comply with EC Directives). (Langley et. al., 1997)
According to Peckol et al. (1994) and Peckol & Rivers (1995) eutrophication in response to hyper-nutrification by nitrogen and phosphorus loads may increase the presence and abundance of macroalgal mats within estuaries. And the occurrence of macroalgal mats has been considered as an indicator of eutrophic conditions in estuaries (Fletcher, 1996a,b). However no detailed studies have been made of the relationship between
nitrate/phosphate levels in streams and the population growths of Ulva lactuca
surrounding Jersey. This study will investigate whether the cause of Ulva lactuca mats
found on the beach in St. Aubin's Bay are due to high nitrate/phosphate levels in streams.
The occurrence of blooms of macroalgae in response to nutrient enrichment may depress the diversity of the estuarine fauna and flora and also decrease species richness (Nicholls et al., 1981; Raffaelli et al., 1987, 1998; Hart og, 1994).
Hypothesis
A comparison between the concentrations of NO3- and P2O5 in fresh water streams and the size of populations of Ulva lactuca in corresponding coastal waters surrounding Jersey.
The study system
Testing concentrations of nitrates and phosphates in stream water is the most suitable system for testing my hypothesis because the data is easy to replicate over a long period of time and there is easy access for collecting water samples.
Design and Methodology
This study will involve both fieldwork and chemical analysis in a laboratory. To test my hypothesis I will need to accurately measure the concentration of nitrate and phosphate at different sites on Jersey. Approximately 36 of samples of water will be taken from several streams using a syringe and small filter from various streams on the island. The samples of fresh water will be collected in small sealed containers, chilled in a cooler and then frozen until the time of chemical analysis to prevent biological growth.
Stream discharge will be measured to estimate the volume of nitrates and phosphates discharging into the corresponding coastal waters. This will be quantified by measuring the stream flow using a flow meter, the depth and width of the stream banks.
The chemical analysis will use a mixed reagent consisting of sulphuric acid (2.4 mol dm-3), ammonium molybdate solution, ascorbic acid and potassium antimonyl tartrate
solution added to the water samples. The absorbance is then measured in a spectrophotometer, which can then be used to find the concentrations of phosphate. Nitrate concentration of the water samples will be determined using an electrode.
Data Summaries and Analyses
The results will be displayed as scatter-graphs that will include standards; a line of best fit will be added. There should be higher phosphate and nitrate levels in streams in
closer proximity to St. Aubin's Bay than those that are further away and do not flow into the bay. I may use t-tests to establish the significance of patterns.
 X
X
X X
X X X
X
X
X X X
X
X X X
X X
X X
X X
X X X
![]() X X X X
X X X X
Distance to St. Aubins Bay
Relevance
This work will investigate the affect of stream nitrate and phosphate concentrations in fresh water streams on population sizes of Ulva Lactuca in the sea surrounding the island of Jersey. This is relevant to environmental sciences as it monitors the ecological impact of pollution in fresh water streams on seawater macro-flora.
Planning Schedule

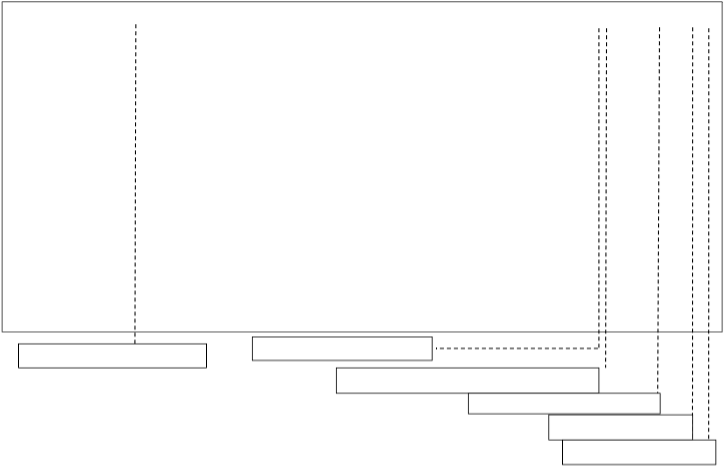 Submit progress report: 20/10/09 Submit Project Proposal: 21/04/08
Seminar presentation: Semester 1 Weeks 8-11
47 Submit completed report: 12/01/10
Submit poster: 26/01/10
Present poster: 05/02/10
Bibliography: Project proposal
Couthino, R. & R . Zingmark, 1993 . Interactions of light and nitrogen on photosynthesis and growth of the marine macroalga Ulva curvata (Kiitzing) De Toni, J. exp. marine Biology Ecology, 167 : 11-19
Fletcher, R. L., 1996a, The occurrence of green tides': a review. In: Schramm W, Nienhuis PH, editors. Marine benthic vegetation: recent changes and the effects of eutrophication. Berlin: Springer-Verlag:7-43.
Fletcher, R. L., 1996b, The British Isles. In: Schramm W, Nienhuis PH, editors. Marine benthic vegetation: recent changes and the effects of eutrophication. Berlin: Springer- Verlag: 223_250.
Fujita, R . M ., P. A . Wheeler & R . L . Edwards, 1989, Assessment of macroalgal nitrogen limitation in a seasonal upwelling region, Marine Ecology Prog., Set 53 : 293- 303.
Hart og, C, 1994, Suffocation of a littoral Zostera bed by Enteromorpha radiata. Aqua Botany; 47:21-28.
Langley, Dr. John, Wyer, Dr. Mark, Kay, Prof. David, Shutes, Dr. Brian, Kett, Dr. Stephen, Gwyn, Merle and Fanthome, Richard, 1997, Stream water quality on the island of Jersey, A report to the States of Jersey Public Services Department.
Nicholls, D. J., Tubbs, C. R., Haynes, F. C., 1981, The effect of green algal mats on intertidal macrobenthic communities and their predators. Keeler Meersforschung; 5:511_520.
Peckol, P., Demeoanderson, B., Rivers, J., Valiela, I., Maldonado, M., Yates, J., 1994, Growth nutrient-uptake capacities and tissue constituents of the macroalgae Cladophora _agabunda and Gracilaria tik_ahiae related to site-specific nitrogen loading rates. Marine Biology; 121:175_185.
Peckol, P., Rivers, J. S., 1995, Physiological responses of the opportunistic macroalgae Cladophora agabunda and Gracilaria tikahiae: McLachlan.to environmental disturbances associated with eutrophication. J Exp Marine Biology Ecology; 190:1_16.
Raffaelli, D., Hull, S., Milne, H., 1987, Long-term changes in nutrients, weed mats and shore birds in an estuarine system. Cahiers Biology Marine; 30:259_270.
Raffaelli D, Raven JA, Poole LJ. Ecological impact of green macroalgal blooms. Oceanography Marine Biology Annual Revue 1998; 36:97_125.
Sand-Jensen, K., 1991, Photosynthetic responses of Ulva lactuca at very low light, Marine Ecology Prog. Ser. 50: 195-201.
Progress Report
Date: 14/10/2009 Work completed to date:
Ecological surveys of marine algae in St. Aubin's and St. Ouen's Bay during the summer of 2009. Measured number of each species and percentage coverage using a quadrat along a transect in the inter-tidal zone of each bay. Four 30m transects (Two for each bay at opposite ends) were measured each with twelve quadrat readings at 3m intervals. Coordinates for each site was recorded by GPS, including elevation above sea level.
Settling plates were also installed at three sites in each bay. These were left for 5-6 weeks during August-October 2009, to measure the abundance and diversity of pioneer species. Two plates were recovered from each bay however, two were lost possibly tampered with or washed away, despite a relatively secure fastening.
On site filtered water samples were taken during March 2008, August 2008, August 2009 at a variety of sites in catchment areas out falling into the bays. Water samples from March 2008 were analysed to obtain preliminary results for nitrate, and orthophosphate concentration.
Explanation of methods:
Due to a lack of previous research in the area, it was felt that data should be collected and analysed to enable sufficient discussion and conclusions for the topic raised. Due to the nature of the discussion question it was necessary to have data on the number of different marine algal species in-situ therefore the most effective measure of this was be using a quadrat along a transect. Settling plates were used to measure the abundance and diversity of pioneer species; any variation may indicate eutrophication in the area. It was also necessary to obtain data on the macro-nutrient loading into each bay.
This data will enable correlation-regression curves to be drawn and t-tests on the data.
Further analyses:
Remaining water samples will be analysed for nitrate, nitrite and orthophosphate concentrations. This data will then be correlated with the number of species in each bay. Some species of algae will be identified as typical of eutrophicated waters and others will be endemic and identified under normal conditions using WFD UK TAG
(2009). T-tests will see if there is a significant difference between concentrations in the St. Aubin's catchment compared to the St. Ouen 's catchment.
Problems
Lost a couple of settling plates so will affect the data. Water samples had to be frozen to limit chemical/biological reactions in the water that may affect the results. This caused initial transportation problems but was resolved. Did not undertake biological monitoring during 2008, due to time constraints and other occupations.
Changed focus
Initially wanted to monitor algal blooms in St. Aubin's Bay however this proved difficult to monitor, and obtain quantifiable data. As although the washed up algae was measurable, the growth of algae could not be monitored and measured below the low- tide mark, which the majority of algae grew at. Therefore I adapted my hypothesis to a wider scope looking at all macro-algae species in the inter-tidal zone.
Review of results
Preliminary results were obtained for nitrate and phosphate on water samples taken in March 2008.
Work plan
- Data analysis: October- early November 2009
- Preparation of seminar: October 2009
- Preparation of first draft report: November 2009
- Drafting report: December 2009
- Submit written report: 12/01/2010
- Submit poster: 26/01/2010
- Present poster: 05/02/2010
Remaining research
Remaining water sample analysis will be conducted Friday 16th October. After which statistical analysis of data can begin during October and November. Write-up of findings will be done over December.