The official version of this document can be found via the PDF button.
The below content has been automatically generated from the original PDF and some formatting may have been lost, therefore it should not be relied upon to extract citations or propose amendments.
STATES OF JERSEY POLICE
Submission to the Environment Scrutiny Panel: Review of Speed Limits Policy
General Observations
- Vehicle speed will invariably be a contributory factor in many road traffic collisions. The slower a vehicle is travelling, the more time the driver has to react to unforeseen factors.
- This is illustrated bythe safe stopping distances listed by the UK Highway Code –
20mph 12 metres
30 mph 23 metres
40 mph 36 metres
- Logically, if speed limits in Jersey were lower and the majority of drivers abided by these limits, the number of road traffic collisions in the Island would be reduced.
- The Police submission to the Speed Limits Review Group also made the point that speed would always be an aggravating factor in determining the severity of an RTC and any associated casualties.
RTC Contributory Factors
- The report also considered, however, the extent to which speeding (ie speed in excess of the prevailing speed limit) was deemed to be a contributory factor in influencing the number of RTCs experienced in Jersey.
- States of Jersey Police use a list of 41 different options when considering the contributory factors that may have caused an RTC. These are based on a national standard but have been adapted for local use. Up to three contributory factors can be assigned to each RTC. These are applied by a member of police staff on the basis of the narrative description in the police officer's RTC report. The contributory factors are inevitably somewhat subjective unless a serious RTC is subject to a specific review by a qualified Accident Investigator. Nevertheless, the aggregated figures provide general indicators for reference by both the Police and Transport and Technical Services. The latter are provided with summary RTC data on a regular basis.
- The contributory factors now include excessive speed' and inappropriate speed for the prevailing conditions'. The former is applied when it is evident that a driver was speeding (ie breaking the speed limit) at the time of the RTC.
- The Police submission to the Speed Limits Review Group reported that speeding was deemed to be the main contributory factor in less than 3% of a sample of 172 injury RTCs in 2008. This sample represented about 50% of the injury RTCs in 2008. This work was done by a university student and was done retrospectively for 2008 in order to provide comparative data in line with revised contributory factors adopted in 2009. One of the significant changes introduced in 2009 was to make the distinction between speeding and inappropriate speed.
- Since August 2009, when the report was produced, the Force has completed full sets of contributory factor data for injury RTCs in 2008 (March onwards), 2009 and 2010. The top 15 results for each year are set out below. These list the primary contributory factors so it is important to note that inappropriate speed for the prevailing conditions' in particular is likely to be a secondary factor in many cases (eg; where weather conditions is deemed to be the primary factor) –
Overall Number of RTCs
- The overall number of injury RTCs recorded in Jersey has not shown any significant change since 2000, despite the increase in the Island's population. Increasing vehicle safety is likely to have played a part in this respect.
| ||||||||||||||||||||||||||||||||||||||||||||
|
|
| ||||||||||||||||||||||||||||||||||||||||||
|
|
|
|
|
|
|
|
|
|
|
|
| ||||||||||||||||||||||||||||||||
|
|
|
|
|
|
|
|
|
|
|
|
|
|
|
|
|
|
|
|
|
|
| ||||||||||||||||||||||
|
|
|
|
|
|
|
|
|
|
|
|
|
|
|
|
|
|
|
|
|
|
| ||||||||||||||||||||||
|
|
|
|
|
|
|
|
|
|
|
|
|
|
|
|
|
|
|
|
|
|
| ||||||||||||||||||||||
|
|
|
|
|
|
|
|
|
|
|
|
|
|
|
|
|
|
|
|
|
|
| ||||||||||||||||||||||
|
|
|
|
|
|
|
|
|
|
|
|
|
|
|
|
|
|
|
|
|
|
| ||||||||||||||||||||||
|
|
|
|
|
|
|
|
|
|
|
|
|
|
|
|
|
|
|
|
|
|
| ||||||||||||||||||||||
2000 | 2001 | 2002 | 2003 | 2004 | 2005 | 2006 | 2007 | 2008 | 2009 | 2010 | ||||||||||||||||||||||||||||||||||
| 387 | 322 | 343 | 307 | 343 | 322 | 336 | 314 | 354 | 345 | 326 | |||||||||||||||||||||||||||||||||
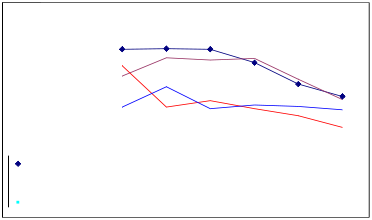
- This also seems to be reflected in data provided by Hospital Accident and Emergency. This shows a 45% reduction in
the number of people Total A&E RTC Attendees
recorded attending A&E 1000
| ||||||||||||
| ||||||||||||
| ||||||||||||
| ||||||||||||
| ||||||||||||
2005 | 2006 | 2007 | 2008 | 2009 | 2010 | |||||||
Total RTC Attendees | 759 | 795 | 703 | 683 | 512 | 418 | ||||||
with RTC injuries 800
between 2005 and 2010. 600
There has been a 400
reduction in the number of
people in each of the main 200
road user types attending 0
A&E with RTC injuries
between 2005 and 2010.
 A&E RTC Attendees by Road User Type
| ||||||||||||||||||||
| ||||||||||||||||||||
|
| |||||||||||||||||||
| ||||||||||||||||||||
|
| |||||||||||||||||||
| ||||||||||||||||||||
|
|
|
|
|
| |||||||||||||||
| ||||||||||||||||||||
|
| |||||||||||||||||||
| ||||||||||||||||||||
2005 | 2006 | 2007 | 2008 | 2009 | 2010 | |||||||||||||||
Motor Vehicle Driver | 218 | 219 | 217 | 186 | 136 | 107 | ||||||||||||||
Motor-cyclist | 155 | 197 | 193 | 196 | 148 | 100 | ||||||||||||||
| Pedestrian | 179 | 82 | 98 | 79 | 63 | 35 | |||||||||||||
Cyclist | 83 | 130 | 79 | 87 | 84 | 76 | ||||||||||||||
Timing of Fatal/Serious Injury RTCs
- This graph shows the number of people injured in RTCs at particular times of day. As can be seen, the main peaks are during the morning and evening rush hours.
 Fatal/Serious Injury RTCs by hour of day March 2008 - February 2011
| ||||||||||||||||||||||||||||||||||||||||||||||||||||||||||||||||||||
|
|
|
|
| ||||||||||||||||||||||||||||||||||||||||||||||||||||||||||||||||
|
|
|
|
|
|
|
|
| ||||||||||||||||||||||||||||||||||||||||||||||||||||||||||||
|
|
|
|
|
|
|
|
|
|
| ||||||||||||||||||||||||||||||||||||||||||||||||||||||||||
|
|
|
|
|
|
|
|
|
|
|
|
|
|
|
|
|
|
| ||||||||||||||||||||||||||||||||||||||||||||||||||
|
|
|
|
|
|
|
|
|
|
|
|
|
|
|
|
|
|
|
|
|
|
|
|
|
|
|
| |||||||||||||||||||||||||||||||||||||||||
|
|
|
|
|
|
|
|
|
|
|
|
|
|
|
|
|
|
|
|
|
|
|
|
|
|
|
|
|
|
|
|
|
| |||||||||||||||||||||||||||||||||||
|
|
| ||||||||||||||||||||||||||||||||||||||||||||||||||||||||||||||||||
|
|
|
|
|
|
|
|
|
|
|
|
|
|
|
|
|
|
|
|
|
|
|
|
|
|
|
|
|
|
|
|
|
|
|
|
|
|
|
|
|
|
| ||||||||||||||||||||||||||
0 | 1 | 2 | 3 | 4 | 5 | 6 | 7 | 8 | 9 | 1 | 011 | 1 | 21 | 314 | 1 | 51 | 61 | 71 | 819 | 20 | 21 | 22 | 23 | |||||||||||||||||||||||||||||||||||||||||||||
Number of RTCs | 3 | 2 | 6 | 2 | 1 | 0 | 2 | 6 | 1 | 3 5 | 8 | 4 | 1 | 0 7 | 9 | 8 | 1 | 3 1 | 4 1 | 4 6 | 8 | 4 | 3 | 6 | ||||||||||||||||||||||||||||||||||||||||||||
|
|
|
|
| ||||||||||||||||||||||||||||||||||||||
|
|
|
|
|
|
|
|
| ||||||||||||||||||||||||||||||||||
|
|
|
|
|
|
|
|
|
|
| ||||||||||||||||||||||||||||||||
|
|
|
|
|
|
|
|
|
|
|
|
|
|
|
|
|
|
| ||||||||||||||||||||||||
|
|
|
|
|
|
|
|
|
|
|
|
|
|
|
|
|
|
|
|
|
|
|
|
|
|
|
| |||||||||||||||
|
|
|
|
|
|
|
|
|
|
|
|
|
|
|
|
|
|
|
|
|
|
|
|
|
|
|
|
|
|
|
|
|
| |||||||||
|
|
|
|
|
|
|
|
|
|
|
|
|
|
|
|
|
|
|
|
|
|
|
|
|
|
|
|
|
|
|
|
|
|
|
|
|
|
|
|
|
|
|
Hour
Benchmarking
- Comparisons with Guernsey and the Isle of Man should be treated with some caution as we would need to ensure that their definitions and recording practices are consistent with ours. Jersey's population is currently 92,500. The last census figures for the other islands were Guernsey 59,807 (2001) and Isle of Man 80,058 (2002).
| Jersey[1] | Guernsey | Isle of Man[2] | |||
| 2009 | 2010 | 2009 | 2010 | 2009 | 2010 |
Fatal | 3 | 3 | 3 | 3 | 6 | 5 |
Serious | 42 | 60 | 16 | 10 | 62 | 57 |
Slight | 300 | 263 | 118 | 121 | 230 | 226 |
Damage only | 374 | 361 | 410 | 429 | 644 | 748 |
Total Recorded RTCs | 719 | 687 | 547 | 563 | 942 | 1036 |
- The Isle of Man maintain similar contributory factor data to the States of Jersey Police. Their figures show that speed (Isle of Man have not introduced the distinction between excessive and inappropriate speed as in Jersey so this figure represents a combination of both factors) was considered to be the primary cause of 21% of injury RTCs and 12% of all RTCs.
Speed Monitor Data
- The Police submission to the Speed Limits Review Group referred to data from three sites. Included below is speed monitor data from a range of sites across the Island.
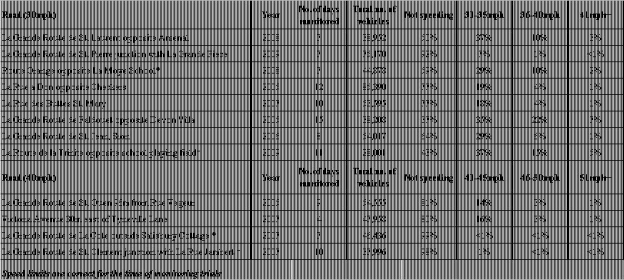
APPENDIX 1
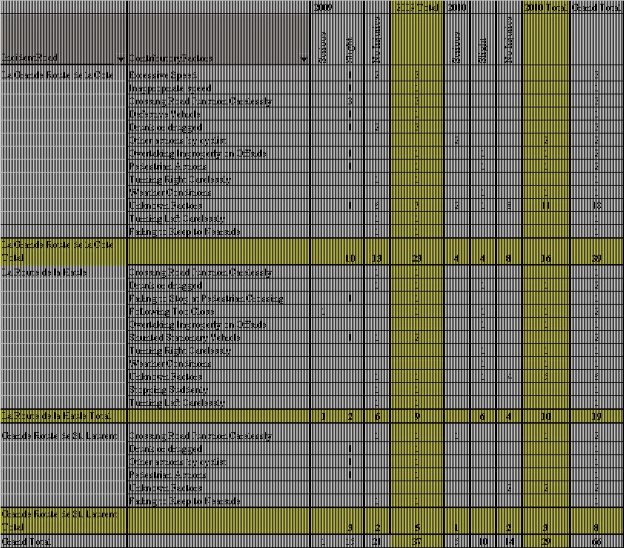
In the original Police submission to the Speed Limits Review Group, speed monitor details in relation to three routes were included. Set out below are the total number of RTCs recorded for those routes and the associated primary contributory factors for 2009 and 2010.
Appendix 2: Public Opinion
States of Jersey Police regularly seek public opinion concerning community safety issues and policing performance through the Jersey Annual Social Survey.
The Police submission to the Speed Limits Review Group drew upon these findings. It was particularly noticeable how people considered speeding to be an issue in their local neighbourhoods but were far less concerned that the issue was an Islandwide problem

 Neighbourhood Issues Islandwide Issues
2007 2005 2003 2007 2005 2003 Excessive speed 52 52 60 21 19 22 Anti-social behaviour 60 59 N/a 69 67 N/a by young people
Young people hanging N/a N/a 31 N/a N/a 22 around in street
Vandalism and graffiti 25 27 21 15 19 18 Rowdy or drunken N/a N/a 18 N/a N/a 37 behaviour
Fighting or assaults in N/a N/a 7 N/a N/a 44 the street
Street violence and 20 18 N/a 46 42 N/a disorder
Burglary of houses 13 13 17 9 9 23 People dealing in 22 24 N/a 68 71 N/a drugs
People using or N/a N/a 17 N/a N/a 70 dealing in drugs
Drink driving 16 18 13 22 25 21 Theft of or from 4 7 8 3 5 7 vehicles
Domestic Violence 7 7 3 11 11 9
In 2009, States of Jersey Police introduced different questions into the Jersey Annual Social Survey asking the public to prioritise different policing activity. The results showed that whilst tackling motorists who drive at very fast speeds" was ranked as a very high or high priority by 79% of respondents (placing it 10th out of 18 options), strict enforcement of the Island's speed limits was scored as a very high or high priority by only 41% (16th out of the 18 options). The full results are shown overleaf.
JASS 2009 included a comprehensive list of eighteen police duties and services and asked the public to prioritise each into "Very high", "High", "Medium" and "Low" priority. Respondents were also able to choose the option "Don't know".
 Very high High Medium Low Don't know
|
|
|
|
| ||||||||||||||||||||||||||
| 76 | % |
|
| 21% | |||||||||||||||||||||||||
|
|
|
|
| ||||||||||||||||||||||||||
| 73 | % |
|
| 21% |
| ||||||||||||||||||||||||
|
|
|
|
| ||||||||||||||||||||||||||
| 73 | % |
|
| 24% | |||||||||||||||||||||||||
|
|
|
|
| ||||||||||||||||||||||||||
| 68% |
|
| 2 | 6% |
| ||||||||||||||||||||||||
|
|
|
|
| ||||||||||||||||||||||||||
| 66% |
|
| 23 | % | 9% | ||||||||||||||||||||||||
|
|
|
|
| ||||||||||||||||||||||||||
| 60% |
| 29% |
| 9% | |||||||||||||||||||||||||
|
|
|
|
| ||||||||||||||||||||||||||
| 57% |
|
| 36% |
|
| ||||||||||||||||||||||||
|
|
|
|
| ||||||||||||||||||||||||||
| 55% |
|
| 34% |
| 9% | ||||||||||||||||||||||||
|
|
|
|
| ||||||||||||||||||||||||||
4 | 2% | 4 | 0% | 15% | ||||||||||||||||||||||||||
|
|
|
|
| ||||||||||||||||||||||||||
3 | 9% | 40 | % | 16% |
| |||||||||||||||||||||||||
|
|
|
|
| ||||||||||||||||||||||||||
37 | % | 37 | % |
| 21% |
| ||||||||||||||||||||||||
|
|
|
|
| ||||||||||||||||||||||||||
4 | 0% | 26% |
| 22 | % | 11% | ||||||||||||||||||||||||
|
|
|
|
| ||||||||||||||||||||||||||
22% |
| 40% | 33 | % |
| |||||||||||||||||||||||||
|
|
|
|
| ||||||||||||||||||||||||||
18% | 34 | % |
| 37% |
|
| ||||||||||||||||||||||||
|
|
|
|
| ||||||||||||||||||||||||||
20% | 31% |
|
| 37% |
| 11% | ||||||||||||||||||||||||
|
|
|
|
| ||||||||||||||||||||||||||
14% |
| 27% | 38 | % | 20% | |||||||||||||||||||||||||
|
|
|
|
| ||||||||||||||||||||||||||
11% | 2 | 1% |
| 43% |
|
| 23% | |||||||||||||||||||||||
|
|
|
|
| ||||||||||||||||||||||||||
| 14% | 4 | 3% | 3 | 5% | |||||||||||||||||||||||||
|
|
|
|
| ||||||||||||||||||||||||||
ResRpeosnpdoinngdi nqgu iqcukilcykltyot oe memeregrgeennccyy ccaalllls
TackTliancgk ltihnge tnheegnlegclteocrt oarbaubsues eo focf hchilidldrerenn aannd
other vulontehraebr lveuplneeorpaleble people
PatrPoalltirnogll inagreaarse awshwehreer ec rcimrimeeoor raannttii--ssoocciiaal
behaviboeurharveioaupr raorbeleamproblem
ReducRinegd uacnintig-saonctiia-sl obceiahlabveiohauvr ioaunrdadndis doirsdoerrd einr in the towtnh ecetnotwrenact ennigthret at night
RedRuecdinugci nthget hseuspupplyp lyo foifl lielleggaal lddrruuggss
TaTcakclkinligngddrirninkk--ddrriivviinngg
TargTeatrignegt ionfgfeonffdeendrse rws hwohop opsoeset htheeggrreeaatteesstt threatthtorecaotmtomcuonimtymsaufneittyy safety
ReducRinegd uacnintig-saonctiia-sl obceiahlabveiohauvr ioaunrdadndis doirsdoerrd einr
in residential areresaidsential areas
ReRdeudcuincgin gd odmomeesstitcicvvioiolelennccee
Tackling moTtoarciskltisn gwmhoo todrriisvtes wathovedrryivfeaastt vseprey efadsst
speeds
Tackling monTeayc klalinugn dmeorninegylaanunddoetrhinegr afinnda ontchiearl
financial crime crime
Protecting JPerrosteeyc tainngdJietsrsterya nansdp oitrst tlriannksspaogrtaliinnksst against terroristetarrtotarcisktsattacks
Tackling Tmaicnkolirn gc rmimineo r( ecgrimvea n(edga lvisamnd/apleistmty /t hpeefttty)
theft)
Working with rWesoirdkeinngtswiinth lorecsaidl ennetisgihnbloocuarhl oods to renseoiglvheb othuerhiro ocdosmtmo ruensiotylves athfeetiry ccoomnmceurnnitsy
EnEfonrfocrincign gli cliecennssiningg llaawwss
Strict enfoSrctreicmteennftorocfetmhee nItsolaf nthde'sIsslapnede'sdslpimeeitds
limits
EnEfonrfcoirncgin groraoaddt rtarafffifcic llaawwss
PatrollingP alotrwol licnrgimloewacrreimase atoreeansgtaogeen gwaigthe awnitdh and reassurree athses uprueb ltiche public
0% 20% 40% 60% 80% 100%
Appendix 3: RTC Contributory Factors
These are the contributory factors used by States of Jersey Police to assess road traffic collisions –
Tired or Asleep
Illness
Drunk or Drugged
Excessive Speed
Inappropriate Speed for Prevailing Conditions Failing to Keep to Nearside
Overtaking Improperly on Nearside
Overtaking Improperly on Offside
Failing to Stop at Pedestrian Crossing
Turning Round Carelessly
Reversing Carelessly
Failing to Comply with Traffic Sign or Traffic Lights Failing to Comply with Double White Lines
Starting from Nearside Carelessly
Starting from Offside Carelessly
Changing Traffic Lanes Carelessly
Cyclist Riding with Head Down
Cyclists more than Two Abreast
Turning Left Carelessly
Turning Right Carelessly
Opening Doors Carelessly
Crossing Road Junction Carelessly
Cyclist Holding Another Vehicle
Stopping Suddenly
Misjudging Clearance
Failing to Comply with Traffic Lights
Incorrect Use of Vehicle Lighting
Following Too Close
Inadequate Vehicle Lighting
Dazzled By Another's Lights
Defective Vehicle
Actions by Vehicle Passengers
Animal/Obstruction in Carriageway
Defective Road
Weather Conditions
Road Surface Contaminants (e.g. Oil, Gravel etc.) Unknown Factors
Pedestrian Actions
Shunted Stationary Vehicle
Other actions by cyclist